Oxford’s Geneva Bible
Visualisation
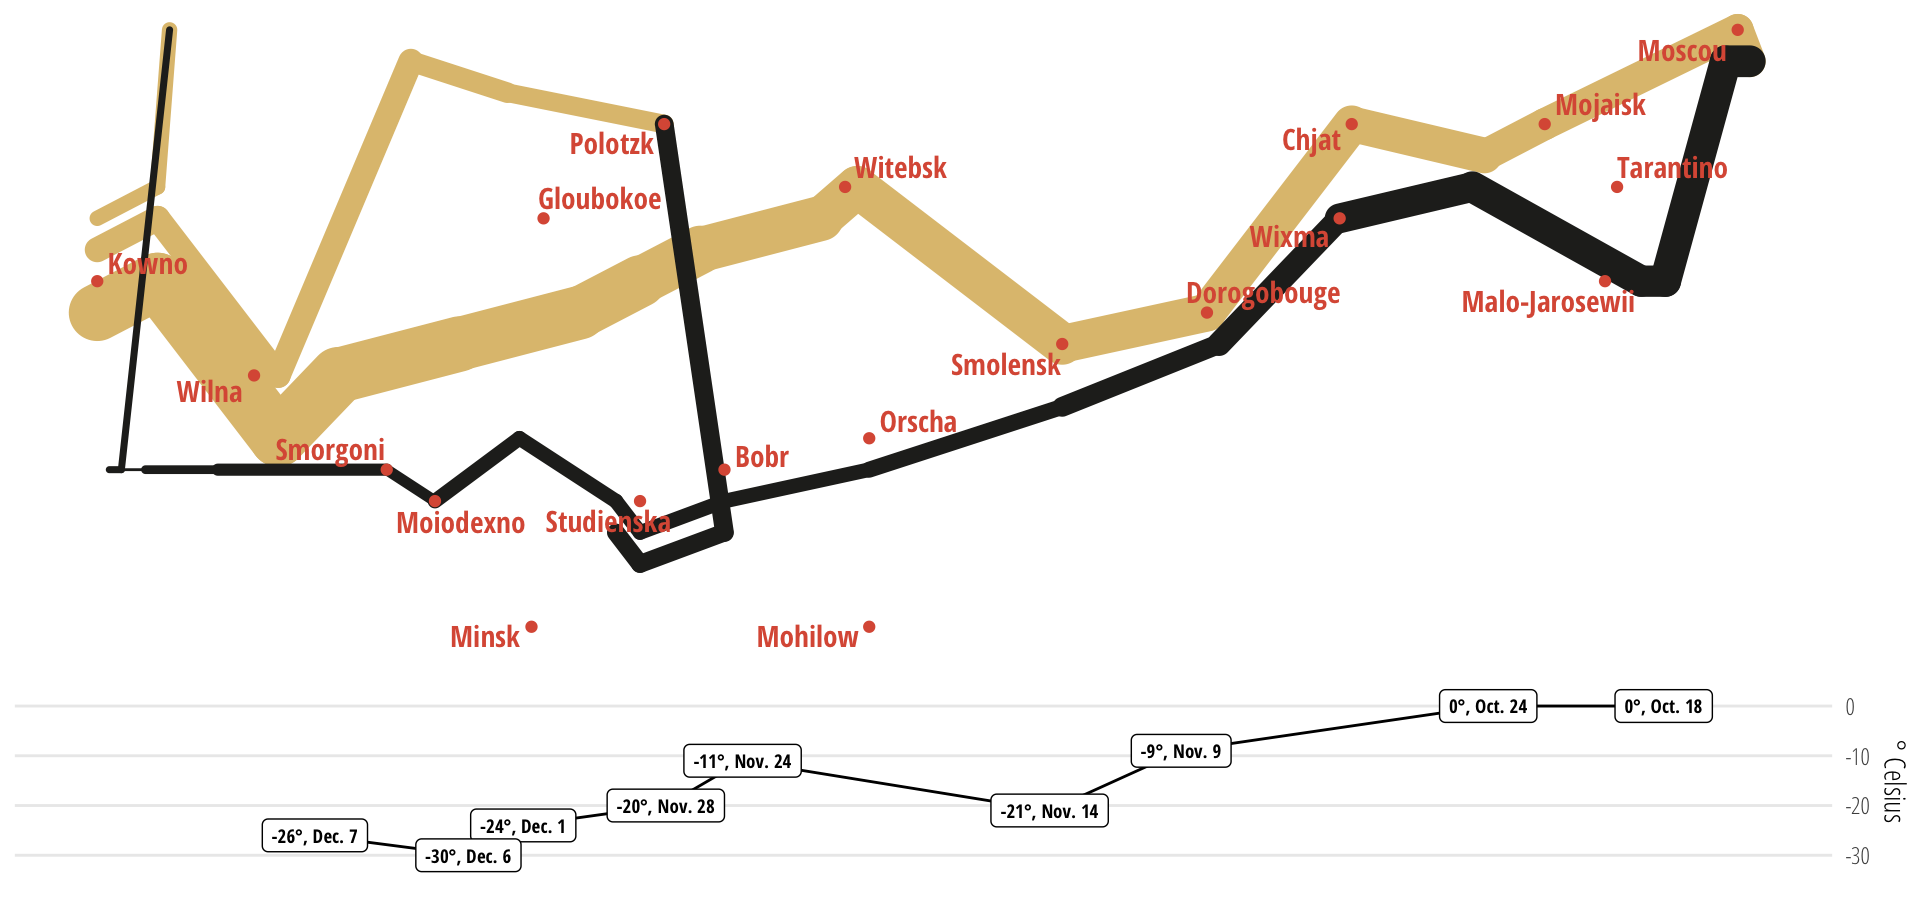
Minard’s famous 1869 chart of Napoleon’s Russian campaign condensed a military catastrophe into a single image that no prose account could match. By showing six variables simultaneously (army size, location, direction, temperature, time, and the devastating attrition) it visualised the scale, duration, cause and result of the disaster in a single image.
The most famous grail expedition in Authorship quests for authenticity must be Roger Stritmatter’s 10-year quest to link in a genuine authorship artefact, an annotated copy of the Geneva Bible owned by De Vere, by connecting the annotation in its margins to Bible references in Shakespeare. The first time we tackled the claim that the annotations demonstrated a significant non-random relationship with the canon, we consulted mathematicians and made a plan. We collected the data, defined its boundaries, cleaned its contents, threw out the broken elements and made lots of tables refuting lots of claims that were commonly made by Oxfordians after Stritmatter published his thesis. We made tables and charts in Excel, which all showed the same thing. There is no significant relationship wherever you look. The statistical claims, “the more a passage is references, the more likely it is to be marked,” or “passages referenced six times are 88% likely to be marked”-(correct figure 3.42%) just don’t add up.
Although the bible analysis occupied a large percentage of Oxfraud dataspace, its share of traffic was pitiful compared to favourite doubter topics like Italy or even the better attempts at humour. Instead of promoting debate, the Geneva Bible claims disappeared almost immediately and have not resurfaced. When Stritmatter began his own detailed calculations, it should have been obvious almost immediately that no relationship would emerge but with the gift Of Oxfordia’s only genuine artefact—hard evidence, Stritmatter soldiered on, published his results and got his doctorate. He now claims that the relationship is (and always was) hermeneutic rather than statistical and centres on three passages. Of course. Why didn’t we spot it?
This time around we’re taking a leaf from Minard’s work, simplifying to the point where you can take in the absence of a relationship in a single glance. Technology has moved on has moved on. AI can sit at your shoulder and fix your plotting mistakes, make suggestions nearly all of which you will reject but which will lead to better ideas, and do things in minutes with data that would have taken days ten years ago—weeks or months back in the 90s. Two years for Minard.
One table and one scatter chart do the whole job.
Beginning at the beginning
| Most popular references | Unmarked (Shaheen) | Marked | % | Stritmatter additions | % | Total | % |
|---|---|---|---|---|---|---|---|
| First 100 | 593 | 14 | 2.36% | 62 | 10.46% | 76 | 12.82% |
| First 1,000 | 2,314 | 93 | 4.02% | 174 | 7.52% | 267 | 11.54% |
| First 2,500 | 3,496 | 93 | 2.66% | 197 | 5.64% | 290 | 8.30% |
| Percentages calculated as a proportion of Shaheen references only. Verses ranked by combined total of all reference types. Figures are now drawn live from the current dataset. | |||||||
The first tabular rendition of the compiled data on marks and references showed exactly where we were going. Strimatter tilted the table by counting all of the marks, except those made in pencil1, as Oxford’s marks. Analysis shows that this is extremely unlikely but the additions still do not affect the broad conclusions. We thought we detected three main annotators with different interests and concerns. However, it turned out there was no need to level things up.
Contrary to Stritmatter’s most important claim, that the more a reference is made to a Bible verse, the more likely it is to be marked, the opposite is almost true. The data says 97.64% of the playwright’s 100 most referenced verses are not marked at all before he started weighting up the balance–making additions to his side of the equation by finding more references (always marked) and throwing out a third of the bible as unsuitable for use by playwrights. Even after the additions, the ratio of matched to unmatched references still refuses to suggest anything approaching a convincing overlap. The very strongest Oxfordian goggles and a large amount of context shearing are necessary before even the feeblest of links can be created between the two datasets.
A single chart
This time around we tried to take a leaf from Minard’s work simplifying the data to the point where you could take in the absence of a relationship in a single glance. Technology has moved on. AI can sit at your shoulder and fix your plotting mistakes, make suggestions and do things in minutes with data that would have taken days ten years ago, weeks or months back in the 90s. Minard must have needed year working with pen, ink and copper engraving — every revision was enormously costly. AI will fix what you break. No more Excel. All the charts and tables here are drawn live from the dataset.
One table and one scatter chart do the job.
The scatter: Marks vs References
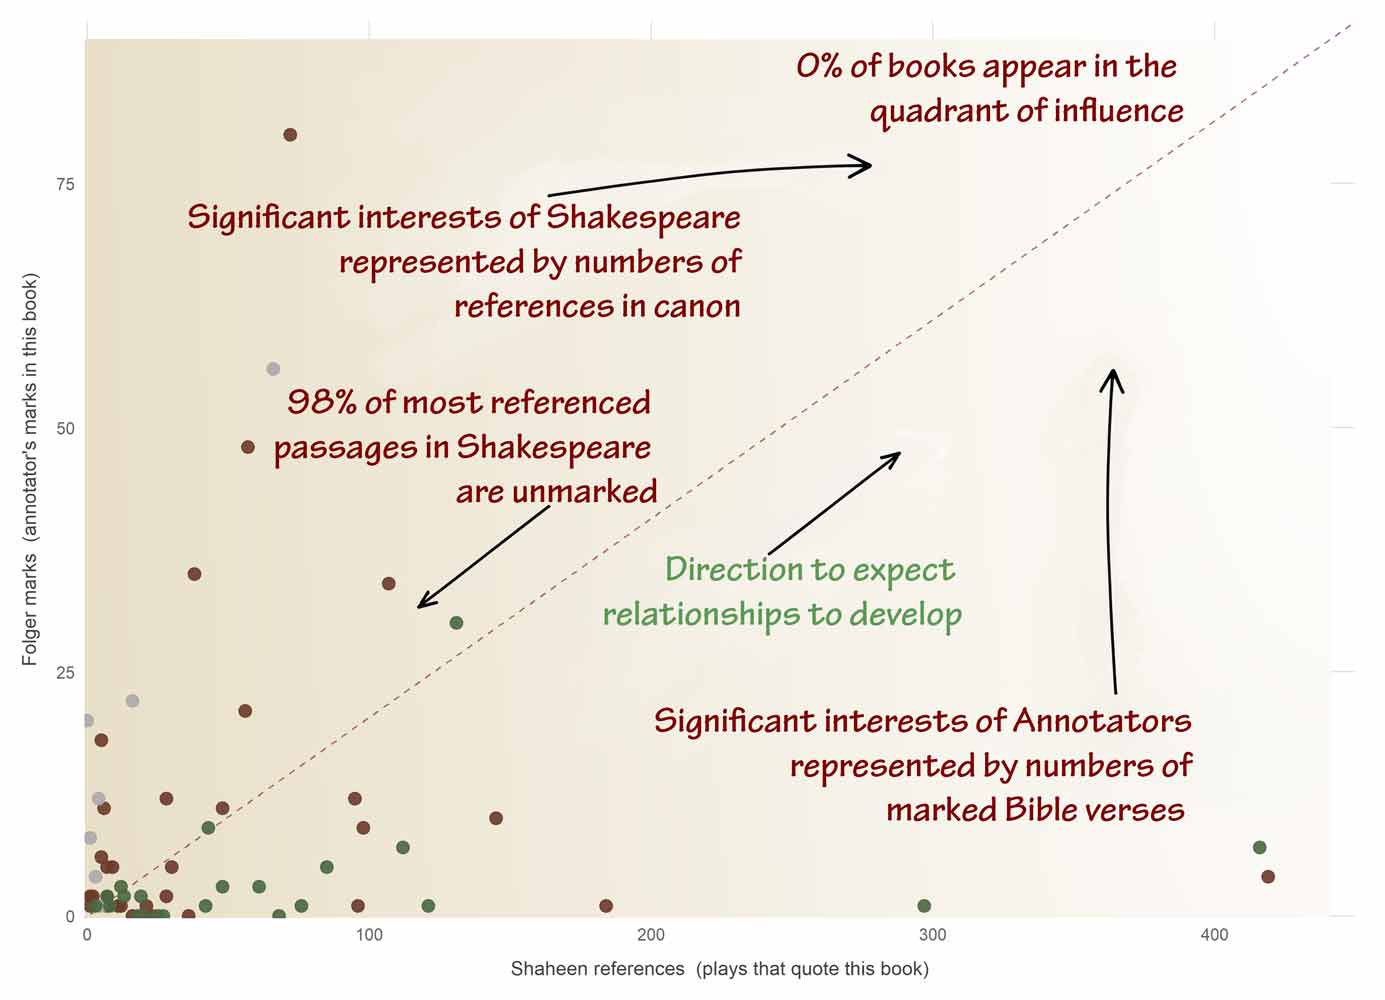
Any significant relationship between marks and references would manifest itself in the top right hand quadrant of this chart. Nothing approaches the darker reagions of the heat map. Nothing even warms up. It looks disappointingly sparse but that’s because the idea that it has relevance to authorship is so far-fetched. The data all look as if they are actively trying to escape a connection with the marks rather than cluster around them.
Hover for detail. Each point represents one Bible book with its collection of marks and references. For there to be any promise of a relationship, the dots should come together toward the top right of the chart, showing a preponderance of shared interest. The chart shows the precise opposite. The area where any relationship should be visible is completely blank — the reddish black hole down which the proposition vanishes. However long you spend studying it, you cannot even begin to imagine a relationship between marks and references that connects the annotators of the Bible to the author of the plays. The data will not help, though we are happy to offer it to anyone who wants to try. Like prisoners, data cannot be forced into telling you what they do not know.
The chart above shows empty space, lots of it, exactly where the marks of any relationship between references and annotations would appear, thickly clustered if any conclusive relationship to Shakespoeare’s writing existed. There’s nothing there. Below there is a live summary table from the dataframe, Again, there’s nothing there. Nothing suggestive, nothing relational, nothing worthy of investigation. Anyone who has worked the data, knows this. It was an obvious hopeless quest, Even Dr Stritmatter knows this. He explained to me, after he looked at the charts, that the relationship between the annotators and the references was hermeneutic in nature, perhaps hoping that I didn’t know what it meant.
Speaking about himself in the third person in the old-fashioned and annoying habit senior academics once had, he tried to make it clear:
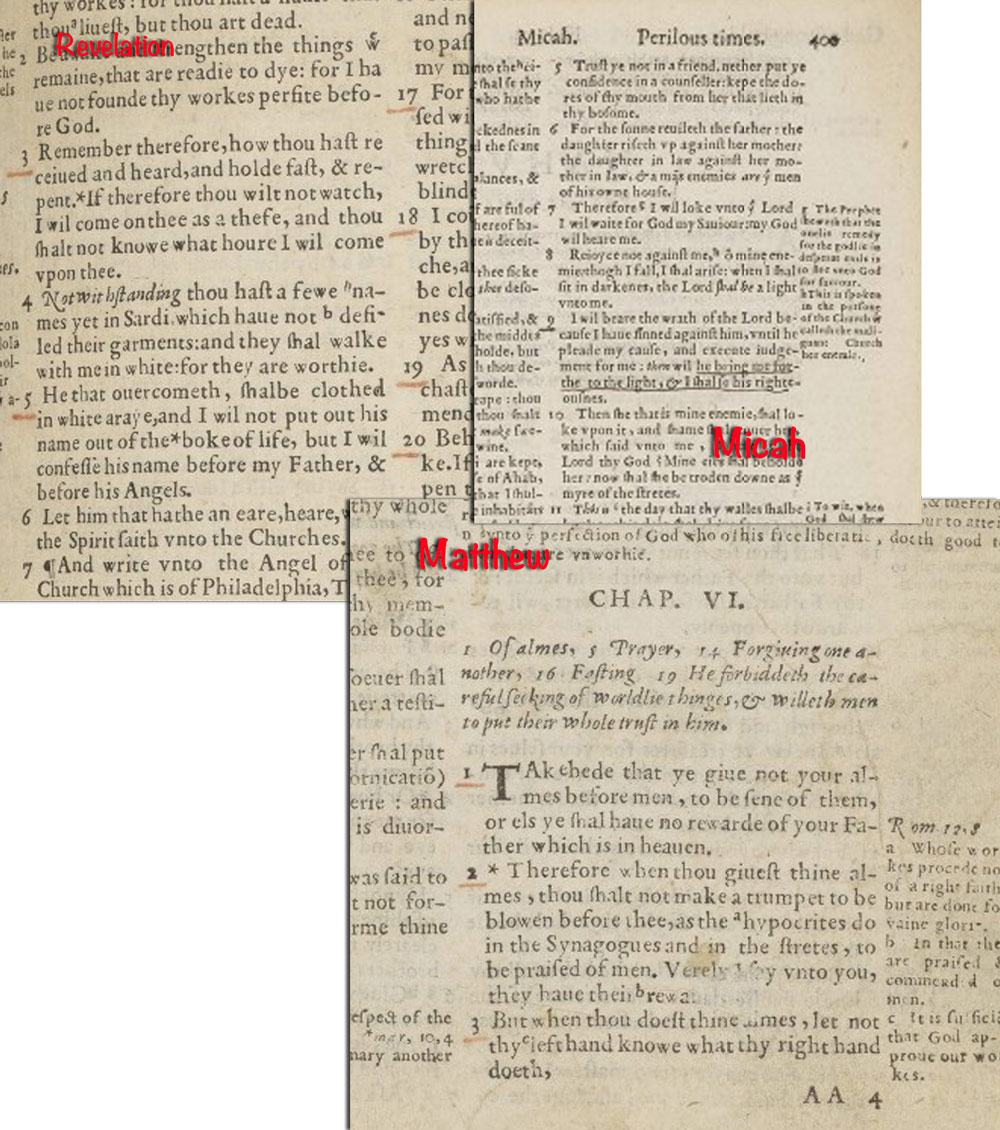
In fact, Stritmatter in his dissertation goes out of his way to make clear that his conclusions do not depend on any statistical operations: “Literary reasoning” is the process of the interpretation of literary texts to form conclusions about their meaning and significance. In literary reasoning, numerical symbols can play a role, but they are never the whole story. They are also not things-in-themselves; they are subordinate to logic and literary inference, to which they contribute when statistically robust. No matter how impressive the number of marked verses which demonstrate an influence in “Shakespeare,” the inner story of these annotations is not told by numbers, but in the brief sequence of marked verses (Micah 7.9, Matthew 6.1-4 and Revelations 3.5: see chapter 26) which comment on the condition of a man whose name has been erased from history and which set forth the divine promise of his eventual redemption. This is a matter of hermeneutics, not calculus.”
This is a matter of allowing a fanciful proposition to occlude judgement from the very beginning. Even if the relationship looked promising, conclusive even, what would Stritmatter have proved? No more than that the annotators were very familiar with Shakespeare’s work. Most Londoners were. The authorship needle would not have moved had the results been 10 times or even 50 times more favourable.
In Short
After grinding the numbers, our view, strengthened over time, is that the relationship between marks and references highlights the differences between the annotators and the playwright, rather than the reverse. Even when they both make lots of marks in the same book they rarely have much in common.
The playwright likes the New Testament. The annotators are keener of The Old.
Shakespeare is soaked in references to Genesis, the annotators have marked only one verse, which the playwright ignored. There is nothing approaching statistical support for the idea that the marks are made by the playwright. In fact, there’s nothing to support the idea that the 17th Earl of Oxford was responsible for all or even any of the annotations. The whole idea is nothing more than another Oxfordian mirage.
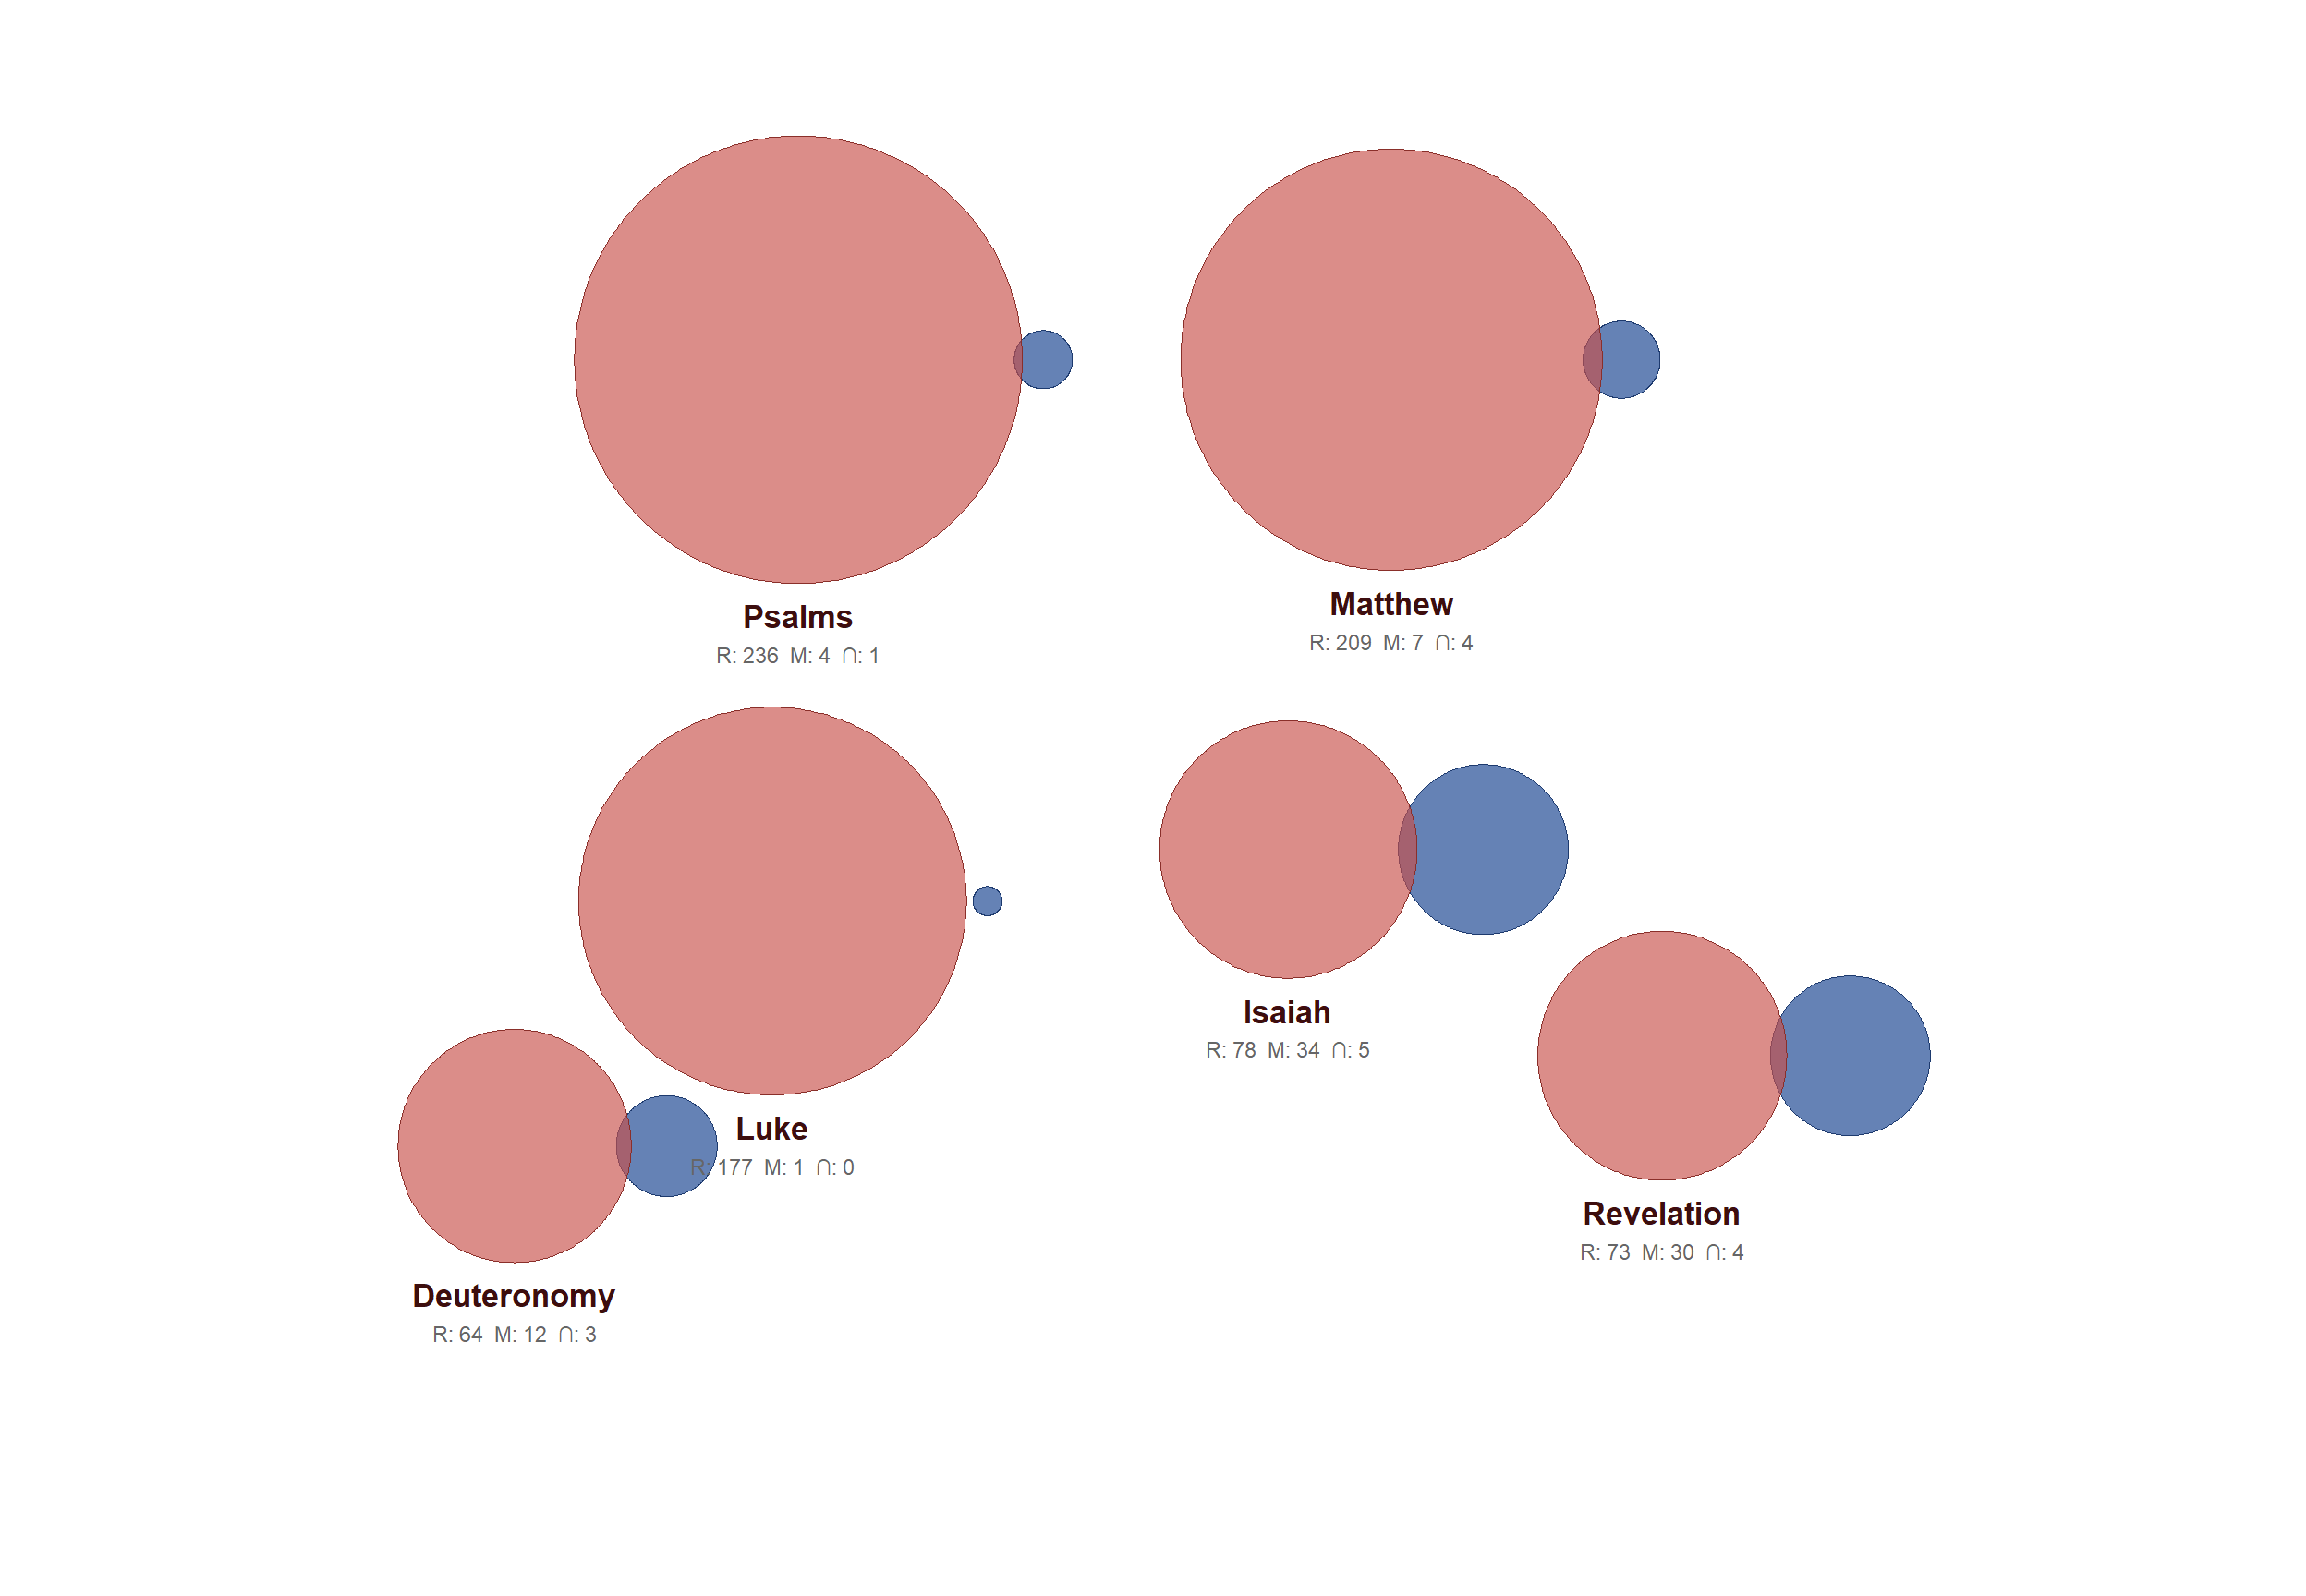
Chart 2 — The dashboard: chapter by chapter
Another benefit from dataframing—another straightforward visualisation of the lack of shared interests. The large red Venn ballons are scaled representations of Shakespeare’s bible references. The blue circles reprent the locations of the marks and the tiny overlaps are the matches between one dataset and the other. Genesis is by far the worst but there are some many references it is out of scale for this chart. So these are none of these examples are near the extremes. Luke has no overlaps.
The complete datatable: all Bible books
This is the whole dataframe from which the statitics, tables and charts are drawn. It’s the Oxfraud dataframe. Anyone building their own will end up with different numbers as the dataframe was cleaned. Broken lines were removed if they were missing fields or ambiguous in any way. Our dataset includes Naseeb Shaheen’s most recent list of just under 3,500 bible references. Professor Shaheen died in 2009 but even a small acquaintance with his work establishes his authority. It seemed fair not to extend the reference data too far beyond that used by Stritmatter.
Since we are working with a larger list of Bible references (and the number of plays has remained the same), the total number of matches has increased from the 80 matches aggregated from Stritmatter’s material by Tom Veal and David Kathman. After finally unearthing a copy of the Appendices to Stritmatter’s thesis, we found it difficult to rebuild any of his totals exactly but we have revised the dataset to make it compatible, while retaining the ability to separate his additions in calculations.
We have also included his Direct and Indirect ’Shakespeare Diagnostics”. Direct Diagnostics are intended to reflect the passages most frequently referenced and Stritmatter and his followers have played some tunes with the more popular passages, hoping to prove that the more a passage is referred to, the more likely it is to be marked.
No such claim is possible. When we compiled our own table of the 100 most referenced passages, it turned out to contain only 34 Strittmatter Diagnostics when it should have contained all of them (apart from his additions). Indirect diagnostics are even more questionable as they are merely connections to connections.
Shaheen’s dataset is based on referenced verses with a list of references to the plays. By isolating this into individual references to plays and creating a single list, we were able to create a “match” field marking those which lie with the boundaries of a mark. Using this process, the pendulum on solid matches came to rest at 107. Add in Stritmatter’s 109 additions and the total adds up to 216, fairly close to number Stritmatter used in his dissertation (199). Counting this way, 3% of references are marked. After his additions, Stritmatter’s total renders 6% of references marked. Stritmatter’s 1000 marked verses are easy to work with. The figures are 10% and 21%.
By our count, 9% of bible references are marked, by his 20%. You will see the latter figure in many Oxfordian arguments, occasionally doubled to 40% by little more than a magic wand.
However you run the data, the realtionship between annotators and the canon is non existent.
Footnotes
Nobody has found a lead pencil made earlier than 1630. Yet.↩︎