Oxford’s Geneva Bible
Introduction
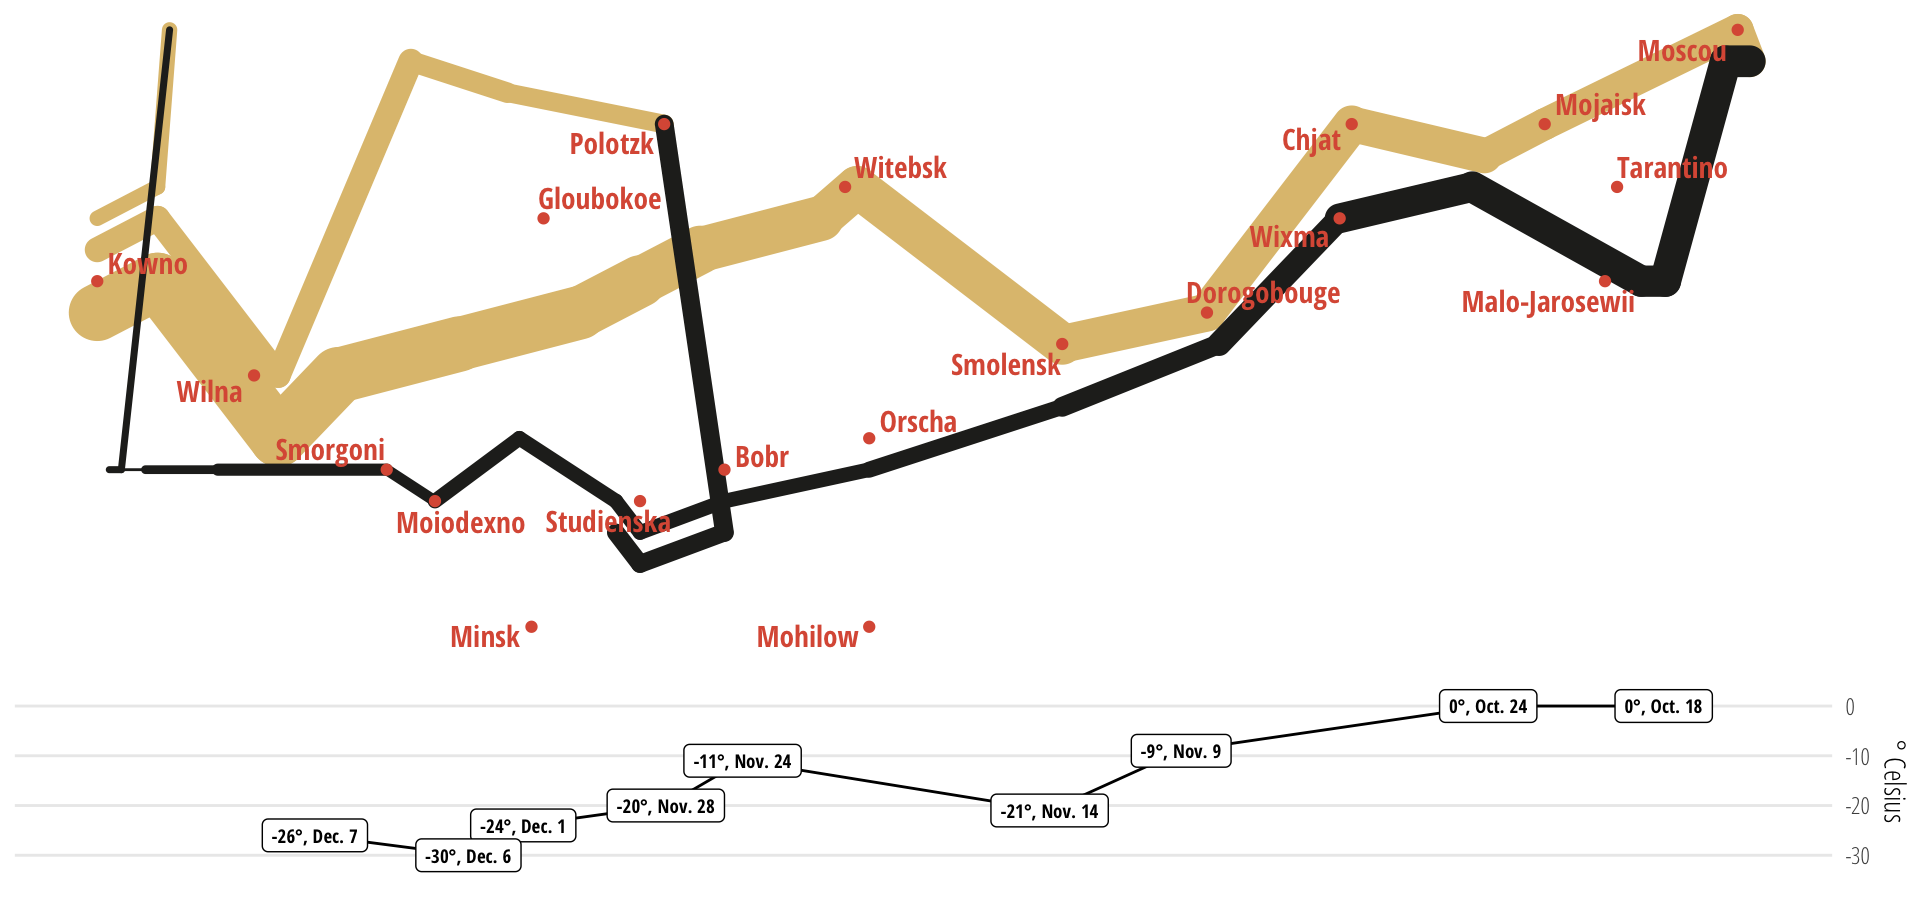
Minard’s famous 1869 chart of Napoleon’s Russian campaign condensed a military catastrophe into a single image that no prose account could match. By showing six variables simultaneously (army size, location, direction, temperature, time, and the devastating attrition) in a single image it visualised the scale, duration, cause and result of the disaster in a single image.. The most famous false grail in Authorship quests for authenticity must be Roger Stritmatter’s 10-year quest to link a genuine authorship artefact, an annotated copy of the Geneva Bible owned by De Vere, and connect the annotation in its margins to Bible references in Shakespeare.
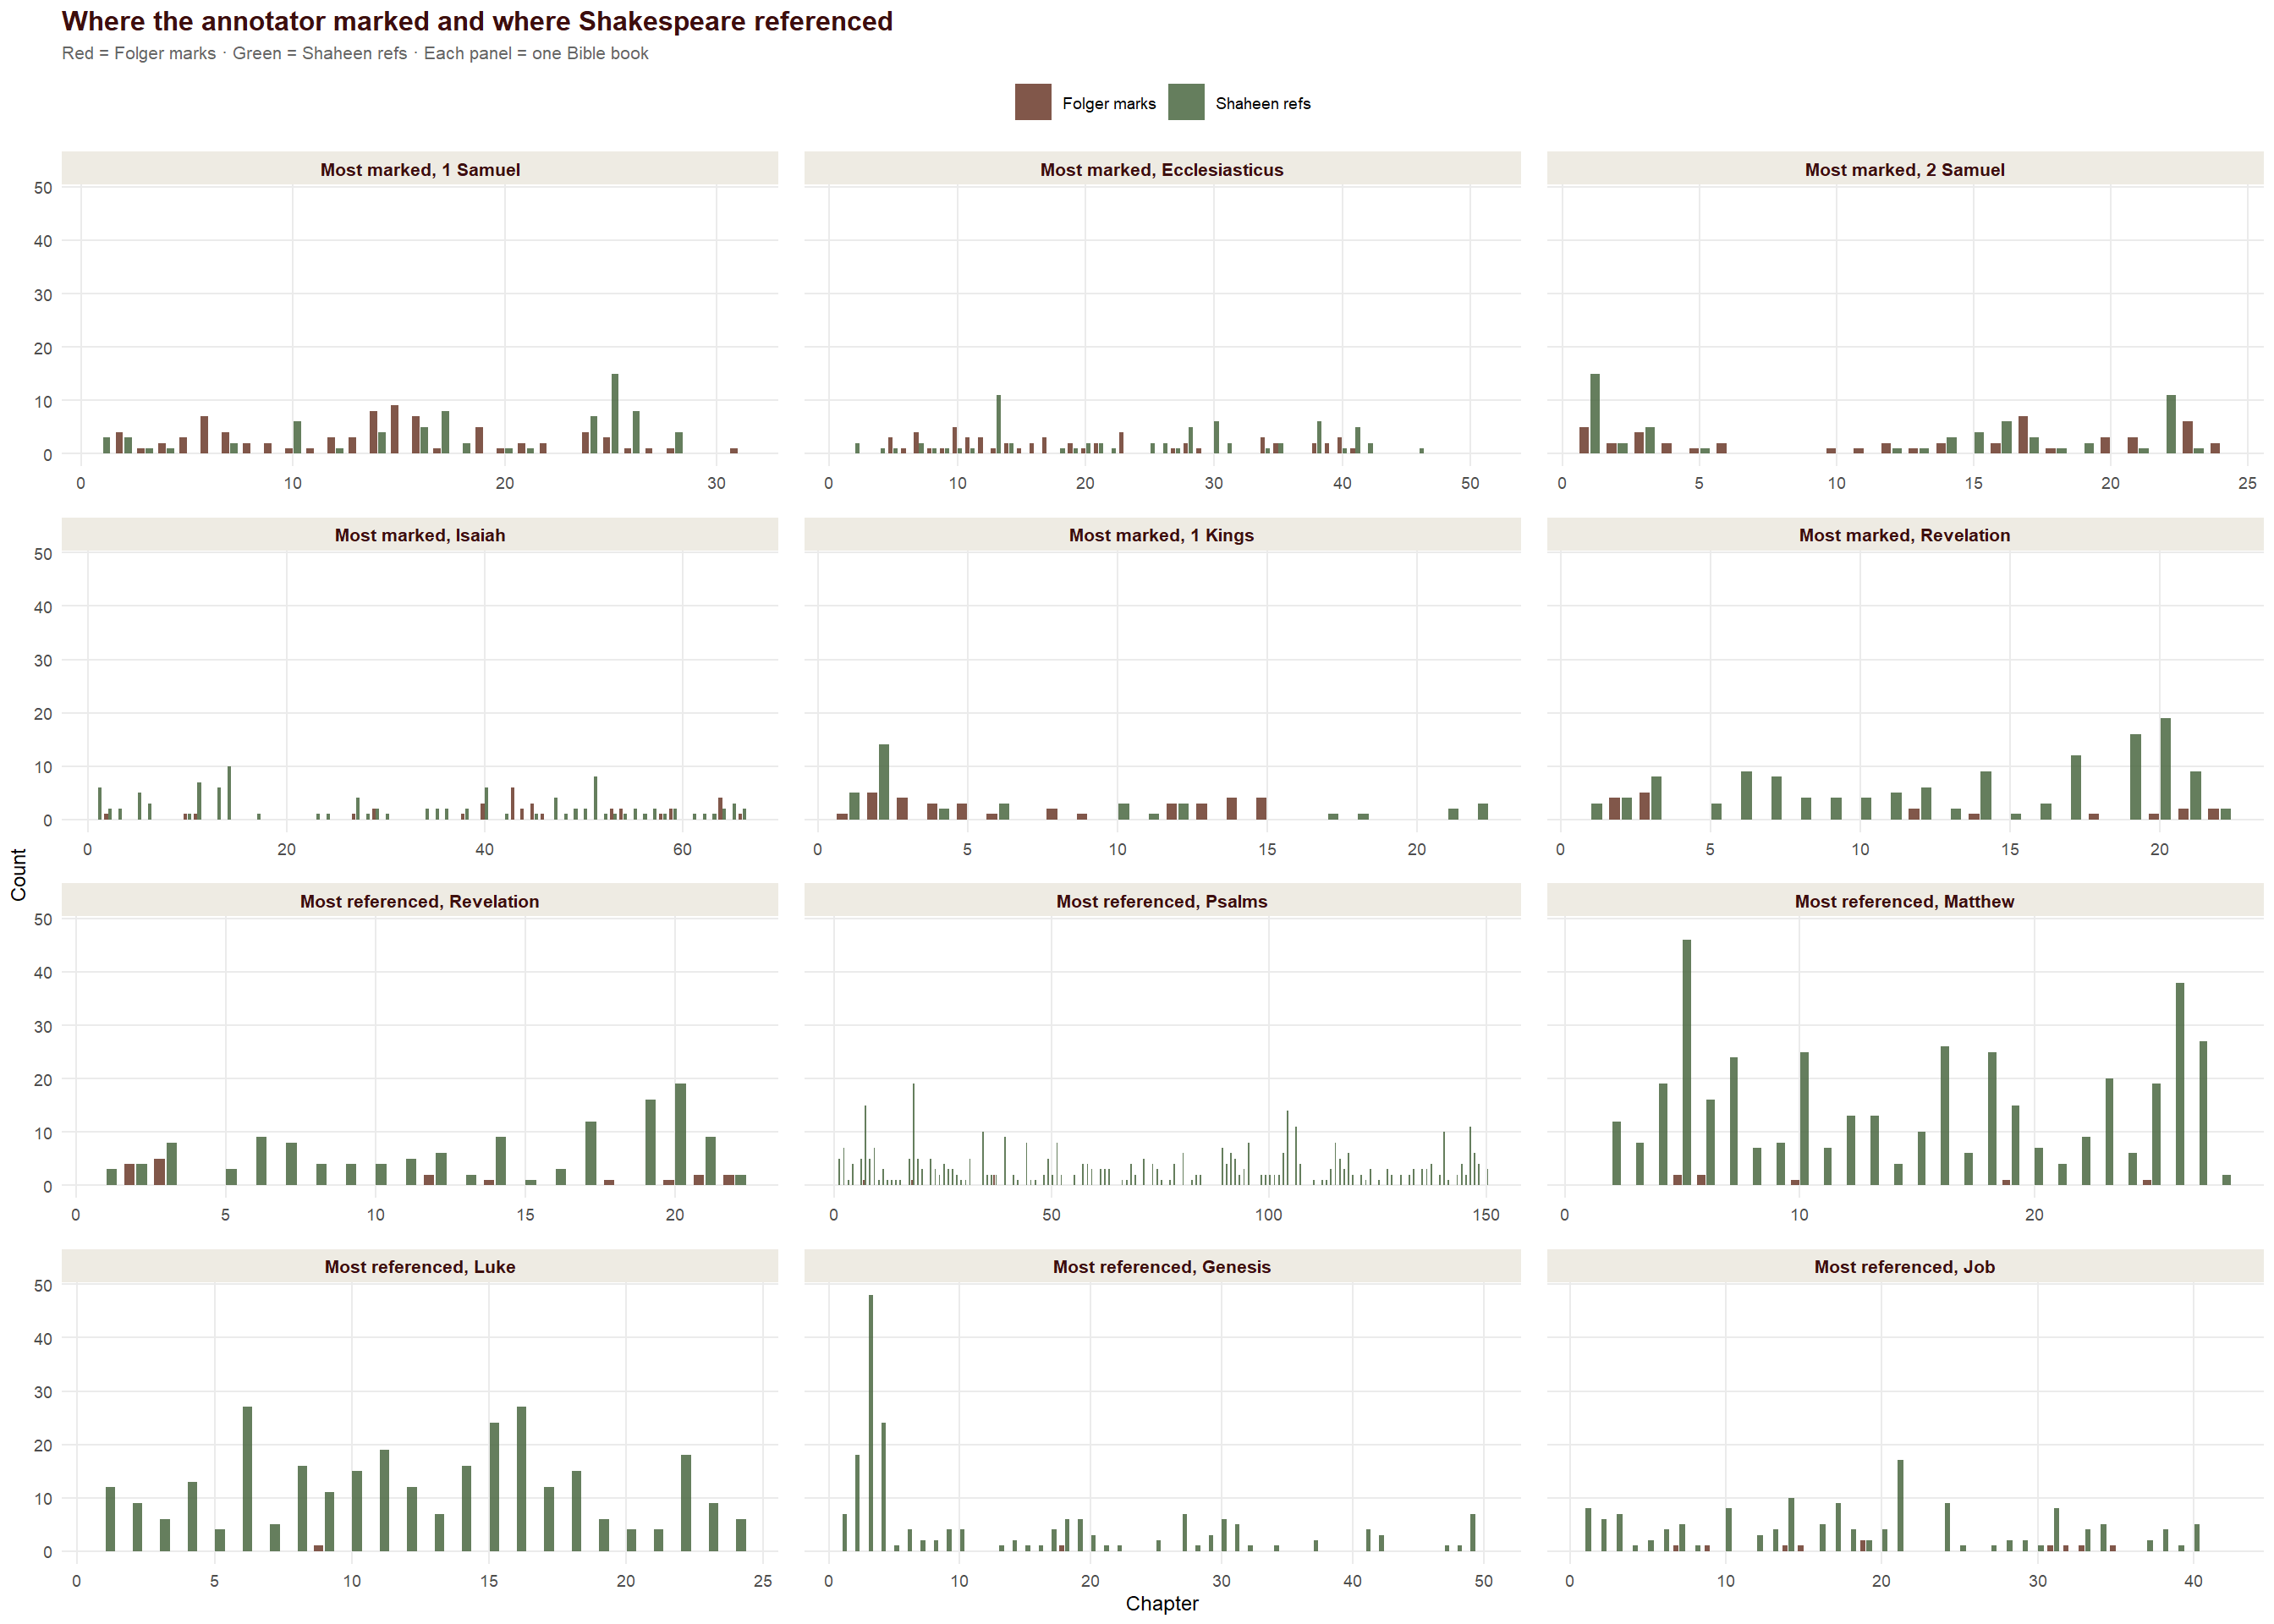
The first time we tackled his claim that the annotations demonstrated a significant non-random relationship with the canon, we consulted mathematicians and made a plan. We collected the data, defined its boundaries, cleaned its contents, threw out the broken elements and made lots of tables refuting lots of claims that were commonly made by Oxfordians after Stritmatter published his thesis. We used R-Studio to make tables and charts, which all showed the same thing. There is not signficant reltionship wherevever you look. The statistical claims, “the more a passage is references, the more likely it is to be marked,” or “passages referenced six times are 88% likely to be marked”-(correct figure 3,42%) just don’t add up.
Although the bible analysis occupied a large percentage of Oxfraud dataspace, its share of traffic was pitiful compared to favourite doubter topics like Italy or even the better attempts at humour. Instead of promoting debate, the Geneva Bible claims disappeared almost immediately and have not resurfaced. It should have been obvious almost immediately that the relationship was non-existent but with a genuine artefact, Stritmatter soldiered on, published his results and got his doctorate. He now claims that the relationship is (and always was) hermeneutic rather than statistical and centres on three passages. Of course. Why didn’t we spot it?
This time around we’re taking a leaf from Minard’s work, simplifying to the point where you can take in the absence of a relationship in a single glance. Technology has moved on has moved on. AI can sit at your shoulder and fix your plotting mistakes, make suggestions nearly all of which you will reject but which will lead to better ideas, and do things in minutes with data that would have taken days ten years ago—weeks or months back in the 90s. Two years for Minard.
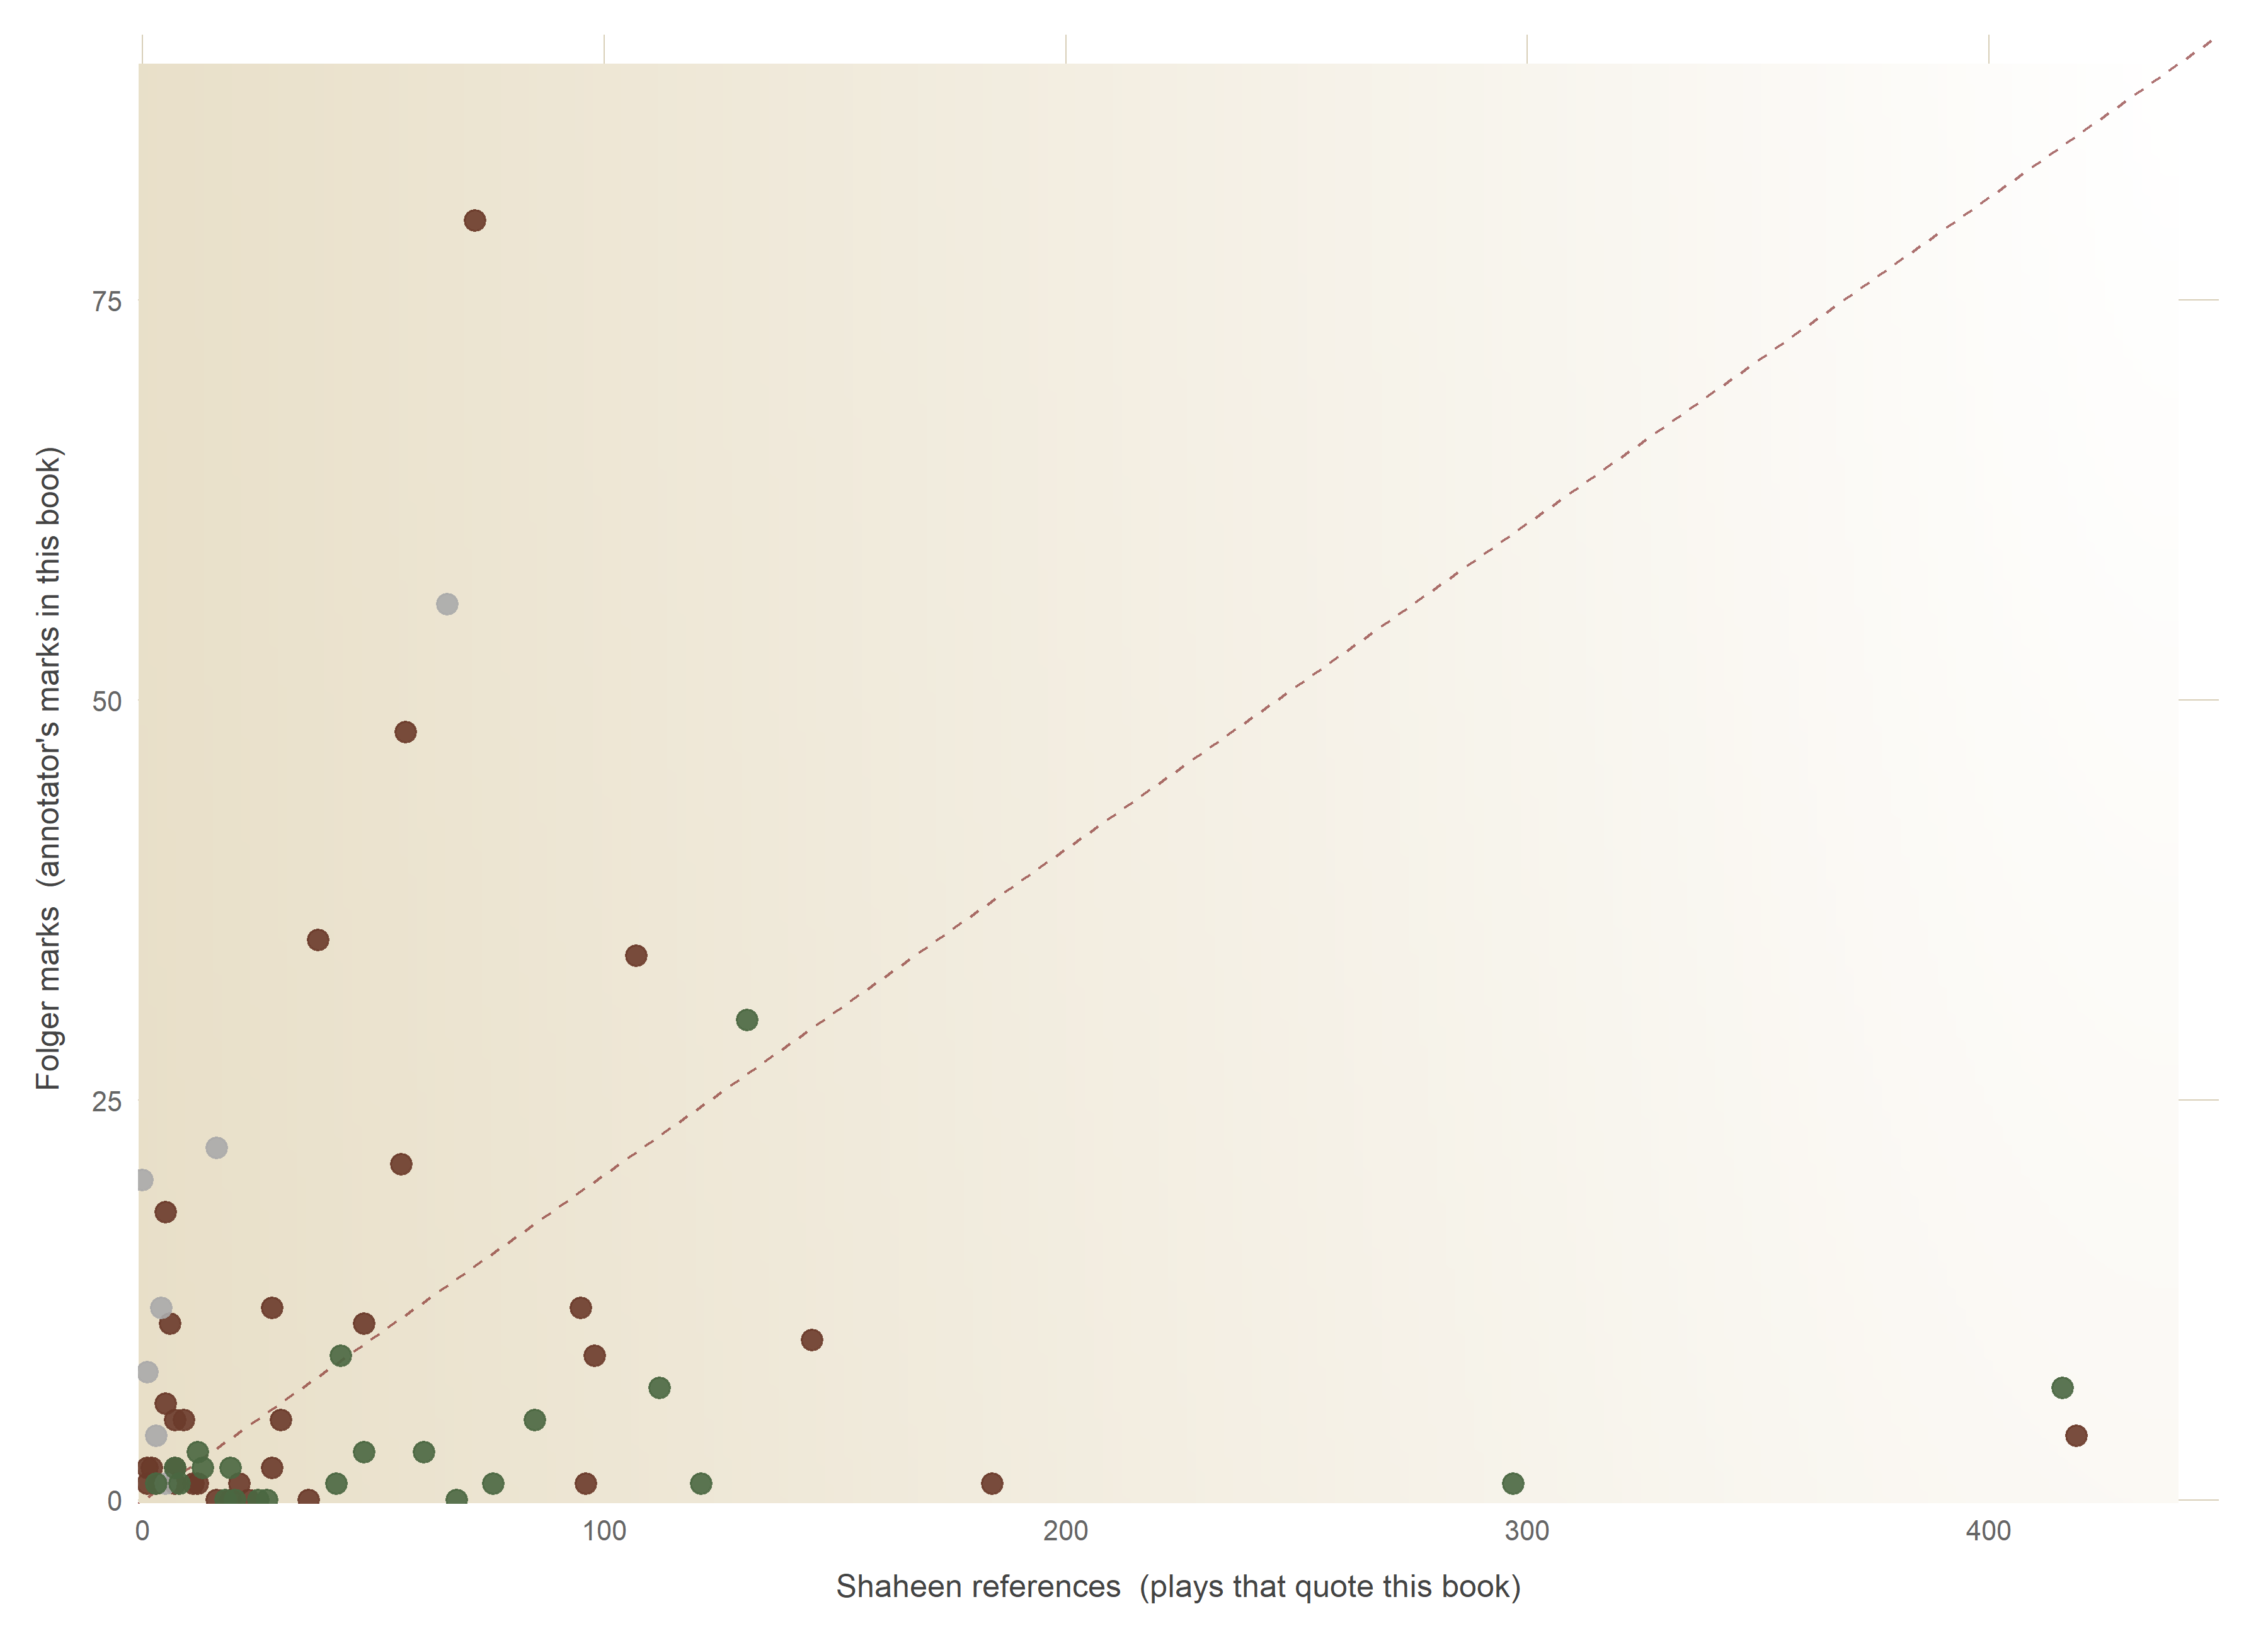
One scatter chart does the whole job.
Beginning at the beginning
library(dplyr)
library(readr)
# Rebuild scatter_data with the same filter you have in the chart chunk
scatter_data <- book_summary %>%
filter(marks > 0 | shaheen > 10)
# Same axis maxes as the chart — keeps distances consistent with what's plotted
x_max <- max(scatter_data$shaheen) * 1.05
y_max <- max(scatter_data$marks) * 1.12
# Distance from the top-right corner, normalised 0..1
# 0 = sitting in the white hole (would support the claim)
# 1 = furthest possible from it (deep parchment, bottom-left)
max_d <- sqrt(x_max^2 + y_max^2)
banded <- scatter_data %>%
mutate(
dist_raw = sqrt((shaheen - x_max)^2 + (marks - y_max)^2),
dist_norm = dist_raw / max_d,
# 5 bands — closest to claim → furthest from it
band = cut(dist_norm,
breaks = c(-Inf, 0.2, 0.4, 0.6, 0.8, Inf),
labels = c("1: In the white hole",
"2: Approaching",
"3: Mid-field",
"4: Far from claim",
"5: Deep parchment"),
right = FALSE)
) %>%
select(booklink_clean, testament, shaheen, marks,
dist_norm, band) %>%
arrange(dist_norm) # closest to white hole first
# Full per-book table, sorted by proximity to the claim zone
write_csv(banded, "scatter-banded.csv")
# Band summary — book lists per band, ready for the column on the right
band_lists <- banded %>%
group_by(band) %>%
summarise(
n = n(),
books = paste(booklink_clean, collapse = ", "),
.groups = "drop"
)
write_csv(band_lists, "scatter-band-lists.csv")
# Echo to console so you can copy from there too
print(banded, n = Inf)
print(band_lists, n = Inf)
'''
<table class="tight-table" style="font-family: "Fira Sans Condensed", sans-serif; font-size: 0.82rem; font-weight: 300;"><thead><tr> <th>Most popular references</th> <th>Unmarked (Shaheen)</th> <th>Marked</th><th>%</th> <th>Stritmatter additions</th><th>%</th> <th>Total</th><th>%</th> </tr></thead><tbody><tr><td>First 100</td><td>593</td><td>14</td><td class="pct">2.36%</td><td>62</td><td class="pct">10.46%</td><td>76</td><td class="pct">12.82%</td></tr><tr><td>First 1,000</td><td>2,314</td><td>93</td><td class="pct">4.02%</td><td>174</td><td class="pct">7.52%</td><td>267</td><td class="pct">11.54%</td></tr><tr><td>First 2,500</td><td>3,496</td><td>93</td><td class="pct">2.66%</td><td>197</td><td class="pct">5.64%</td><td>290</td><td class="pct">8.30%</td></tr></tbody><tfoot><tr><td colspan="8"> Percentages calculated as a proportion of Shaheen references only. Verses ranked by combined total of all reference types. Figures are now drawn live from the current dataset.</td></tr></tfoot></table>
The first tabular rendition of the compiled data on marks and references showed exactly where we were going. Strimatter tilted the table by counting all of the marks, except those made in pencil[^1], as Oxford's marks. Analysis shows that this is extremely unlikely but does not affect the broad conclusions. We thought we detected three main annotators with different interests and concerns. However, it turned out there was no need to level things up.
[^1]: Nobody has found a lead pencil made earlier than 1630. Yet.
Contrary to Stritmatter's most important claim, that the more a reference is made to a Bible verse, the more likely it is to be marked, the opposite is almost true. The data says
*97.64%
of the playwright's 100 most referenced verses are not marked at all* **before** he started weighting up the balance--making additions to his side of the equation by finding more references (always marked) and throwing out a third of the bible as unsuitable for use by playwrights. Even after the additions, the ratio of matched to unmatched references still refuses to
suggest anything approaching a convincing overlap. The very strongest Oxfordian goggles and
a large amount of context shearing are necessary before even the feeblest of links can be
created between the two datasets.
### A single chart
This time around we tried to take a leaf from Minard's work and simplify something visual to the point where you could take in the absence of a relationship in a single glance. Technology has moved on. AI can sit at your shoulder and fix your plotting mistakes, make suggestions and do things in minutes with data that would have taken days ten years ago, weeks or months back in the 90s. Minard must hav needed year working with pen, ink and copper engraving — every revision was enormously costly. We iterated the scatter chart a dozen times this week alone, each iteration taking minutes.
One scatter chart does the job.
---
#### The scatter: marks vs references
::: {.cell}
::: {.cell-output-display}
{width=1800}
:::
:::
::: {.cell}
::: {.cell-output-display}
```{=html}
<div class="plotly html-widget html-fill-item" id="htmlwidget-a3915a25f2dcaeda912a" style="width:100%;height:464px;"></div>
<script type="application/json" data-for="htmlwidget-a3915a25f2dcaeda912a">{"x":{"data":[{"x":[0,5.5689873417721527,11.137974683544305,16.706962025316457,22.275949367088611,27.844936708860764,33.413924050632914,38.982911392405072,44.551898734177222,50.120886075949372,55.689873417721529,61.258860759493679,66.827848101265829,72.396835443037986,77.965822784810143,83.534810126582286,89.103797468354443,94.672784810126601,100.24177215189874,105.8107594936709,111.37974683544306,116.9487341772152,122.51772151898736,128.0867088607595,133.65569620253166,139.22468354430382,144.79367088607597,150.36265822784813,155.93164556962029,161.50063291139242,167.06962025316457,172.63860759493673,178.20759493670889,183.77658227848104,189.3455696202532,194.91455696202536,200.48354430379749,206.05253164556964,211.6215189873418,217.19050632911396,222.75949367088612,228.32848101265827,233.8974683544304,239.46645569620256,245.03544303797472,250.60443037974687,256.173417721519,261.74240506329119,267.31139240506332,272.8803797468355,278.44936708860763,284.01835443037982,289.58734177215194,295.15632911392407,300.72531645569626,306.29430379746839,311.86329113924057,317.4322784810127,323.00126582278483,328.57025316455702,334.13924050632914,339.70822784810133,345.27721518987346,350.84620253164564,356.41518987341777,361.9841772151899,367.55316455696209,373.12215189873422,378.6911392405064,384.26012658227853,389.82911392405072,395.39810126582285,400.96708860759497,406.53607594936716,412.10506329113929,417.67405063291147,423.2430379746836,428.81202531645573,434.38101265822792,439.95000000000005],"y":[0,1.1341772151898735,2.2683544303797469,3.4025316455696206,4.5367088607594939,5.6708860759493671,6.8050632911392412,7.9392405063291145,9.0734177215189877,10.207594936708862,11.341772151898734,12.475949367088608,13.610126582278482,14.744303797468355,15.878481012658229,17.012658227848103,18.146835443037975,19.281012658227848,20.415189873417724,21.549367088607596,22.683544303797468,23.817721518987344,24.951898734177217,26.086075949367089,27.220253164556965,28.354430379746837,29.48860759493671,30.622784810126582,31.756962025316458,32.891139240506334,34.025316455696206,35.159493670886079,36.293670886075951,37.427848101265823,38.562025316455696,39.696202531645568,40.830379746835447,41.96455696202532,43.098734177215192,44.232911392405065,45.367088607594937,46.501265822784809,47.635443037974689,48.769620253164561,49.903797468354433,51.037974683544306,52.172151898734178,53.30632911392405,54.44050632911393,55.574683544303802,56.708860759493675,57.843037974683547,58.977215189873419,60.111392405063292,61.245569620253164,62.379746835443044,63.513924050632916,64.648101265822788,65.782278481012668,66.916455696202533,68.050632911392412,69.184810126582278,70.318987341772157,71.453164556962022,72.587341772151902,73.721518987341781,74.855696202531647,75.989873417721526,77.124050632911391,78.258227848101271,79.392405063291136,80.526582278481015,81.660759493670895,82.79493670886076,83.92911392405064,85.063291139240505,86.197468354430384,87.331645569620264,88.465822784810129,89.600000000000009],"z":[[0,0.012151008239806194,0.024295659527175495,0.036433713495727327,0.048564917647028416,0.060689006584813687,0.072805701191228422,0.084914707739982775,0.0970157169407877,0.10910840290888091,0.12119242205280401,0.13326741187289182,0.14533298966213681,0.15738875110021622,0.16943426873046818,0.18146909030851011,0.19349273700994463,0.2055047014832061,0.21750444573204419,0.22949139881037806,0.24146495431027892,0.25342446762161219,0.26536925293935165,0.27729857999174667,0.28921167045930485,0.30110769405093263,0.31298576419945667,0.32484493333408859,0.3366841876821085,0.34850244154602983,0.36029853099569087,0.37207120690694206,0.38381912726977285,0.39554084867866268,0.40723481690648788,0.41889935645027443,0.43053265892224124,0.44213277014267438,0.4536975757719478,0.4652247852971737,0.47671191416418812,0.48815626381755073,0.49955489937960595,0.51090462466411479,0.52220195418022963,0.53344308173848809,0.54462384522198182,0.5557396870331599,0.56678560967042824,0.57775612582999258,0.58864520236927043,0.59944619741190008,0.61015178982583307,0.62075390027257638,0.63124360301796634,0.64161102772807543,0.65184525056904941,0.66193417411578481,0.67186439589024816,0.68162106584697901,0.69118773386634658,0.70054618938634672,0.70967629679662747,0.71855583223905883,0.7271603301097429,0.73546295091377689,0.74343438619542968,0.75104282093333441,0.75825397871941247,0.76503127958086925,0.77133614338934187,0.77712847189700873,0.78236733762573252,0.78701189610800293,0.79102251786101185,0.79436210792502082,0.79699754620404906,0.79890114666771372,0.80005200588605474,0.80043710048441641],[0.00050105326997940125,0.012658227848101222,0.024809195832974473,0.036953722294689073,0.049091560429487924,0.061222450809008344,0.073346120572567841,0.08546228255745425,0.097570634361680231,0.10967085733309534,0.12176261547811706,0.13384555428264644,0.14591929943694326,0.15798345545537296,0.17003760418094083,0.18208130316345106,0.19411408389888662,0.2061354499162279,0.21814487469638233,0.23014179940614499,0.24212563042815083,0.25409573666555985,0.26605144659771518,0.27799204506019026,0.2899167697194418,0.30182480720865956,0.31371528888731237,0.32558728618221344,0.33743980546265484,0.34927178239613366,0.36108207572436068,0.37286946039143898,0.38463261994723441,0.39637013813883282,0.40808048959144338,0.41976202946693875,0.43141298197321376,0.44303142758041847,0.45461528878060098,0.46616231420508114,0.47767006088859076,0.48913587444054241,0.50055686685131329,0.51192989162480873,0.52325151588745245,0.53451798907788106,0.54572520777085365,0.55686867613334401,0.56794346145088481,0.57894414409900719,0.58986476126984777,0.60069874370069032,0.61143884459403053,0.62207705987478934,0.63260453890992108,0.64301148483382997,0.65328704370077473,0.66341918185197035,0.67339455118003266,0.68319834244935806,0.69281412755625804,0.70222369267274076,0.71140686571551903,0.7203413436328685,0.7290025277235137,0.7373633786889815,0.74539430740587032,0.75306312239106066,0.76033506030415121,0.76717293093408545,0.77353741184363334,0.77938752856335858,0.78468135183748622,0.78937693166718748,0.7934334670001657,0.79681267959968238,0.79948032325580176,0.80140772088023937,0.80257319111982084,0.80296321313651231],[0.00099597021878672365,0.013159241802034871,0.025316455696202556,0.037467382367362245,0.049611780664812088,0.061749397085337554,0.07387996498154048,0.086003203709277609,0.098118817708749972,0.11022649551323005,0.12232590867878512,0.13441671062767235,0.14649853539729385,0.15857099628574922,0.17063368438403803,0.18268616698389284,0.19472798584899675,0.20675865533597371,0.2187776603500009,0.23078445411816395,0.24277845576171675,0.25475904764621504,0.26672557248599671,0.2786773301766754,0.29061357432612578,0.30253350845083038,0.31443628180036554,0.32632098476815052,0.33818664384129615,0.35003221603637347,0.3618565827610738,0.37365854303390744,0.38543680598518792,0.39718998255236793,0.40891657627117628,0.42061497305072815,0.4322834298056154,0.44392006180065313,0.45552282854416215,0.46708951804307963,0.47861772920743528,0.49010485216241573,0.50154804619295601,0.51294421500812282,0.5242899789700719,0.5355816438847596,0.54681516589859624,0.55798611198685411,0.56908961545615344,0.58012032581559714,0.59107235230065247,0.60193920026346515,0.61271369957729638,0.62338792414798194,0.63395310159178453,0.64439951214146307,0.65471637590173615,0.66489172772090543,0.67491227921747798,0.68476326795324605,0.69442829444841325,0.70388914878015529,0.7131256300036144,0.72211536371049223,0.73083362582795064,0.73925318437543663,0.74734417539660969,0.75507403459834044,0.76240751206299151,0.76930680310311095,0.77573183275559854,0.78164073283218405,0.78699054656843248,0.7917381842040857,0.7958416311775236,0.7992613784640733,0.80196200423585262,0.80391379362468252,0.8050942487526509,0.80548932578860832],[0.0014847417219664427,0.01365404064512965,0.025817429312370854,0.037974683544303778,0.050125567800641369,0.062269834459468654,0.074407223041613513,0.086537459375235826,0.098660254695263183,0.11077530467175334,0.12288228836064141,0.1349808670696564,0.14707068313141614,0.15915135857486129,0.17122249368522302,0.18328366544165053,0.19533442582041682,0.2073742999502618,0.21940278410491165,0.23141934351609139,0.24342340998841683,0.25541437929535504,0.26739160833298248,0.27935441200546185,0.29130205981299773,0.30323377210943059,0.31514871599255023,0.32704600078556689,0.33892467306290097,0.35078371116743201,0.36262201915949521,0.37443842013007833,0.38623164880173855,0.39800034333053025,0.40974303621055597,0.42145814416936667,0.43314395692713969,0.44479862467503362,0.45642014410806686,0.4680063428249337,0.47955486188095087,0.49106313625042175,0.50252837292062136,0.51394752630091622,0.52531727058672184,0.53663396866869151,0.54789363712234529,0.55909190675216369,0.57022397809711323,0.58128457123226851,0.59226786912500184,0.60316745372659442,0.61397623390515266,0.62468636425982194,0.63528915380918649,0.64577496353282093,0.65613309178495227,0.6663516467224444,0.67641740513661763,0.68631565750509371,0.69603003975943534,0.70554235329153725,0.71483237621397477,0.72387767098494749,0.73265339635620474,0.74113213534064348,0.74928375561012417,0.75707532438453318,0.76447110619067915,0.77143267821175387,0.77791920313969587,0.78388790165053124,0.78929476336322357,0.7940955235708651,0.79824691066752129,0.80170813513638828,0.80444254741579069,0.80641934542519889,0.80761517376820402,0.80801543844070434],[0.0019673587505992796,0.014142615019349547,0.02631210697844022,0.038475615760635296,0.050632911392405,0.06278375208819631,0.0749278834908359,0.087065037853267357,0.099194933156337761,0.1113172721568062,0.12343174135913859,0.13553800990398046,0.14763572836543859,0.15972452744846322,0.17180401657666367,0.18387378235984053,0.19593338692931339,0.20798236612778342,0.22002022753896344,0.23204644834049826,0.24406047296178357,0.25606171052611615,0.26804953205415527,0.28002326740289674,0.29198220191120405,0.30392557271936804,0.31585256472609669,0.3277623061417142,0.33965386359107141,0.35152623671366678,0.36337835220161885,0.37520905720828557,0.38701711205137268,0.39880118212411098,0.41055982891633525,0.42229150003383165,0.43399451808889034,0.44566706831729619,0.45730718475669707,0.46891273479802864,0.48048140189502064,0.49201066618632261,0.50349778274995449,0.51493975717009588,0.52633331805113581,0.53767488606291991,0.54896053904378994,0.56018597262405367,0.57134645576190835,0.58243678050700853,0.59345120522491568,0.60438339043078382,0.61522632629654028,0.62597225081858165,0.63661255757191304,0.64713769194573734,0.65753703477517011,0.66779877238331653,0.67790975226851891,0.68785532406964123,0.69761916609371966,0.70718309869426443,0.71652688726975355,0.72562803976006607,0.73446160641993874,0.74299999350486012,0.7512128074313893,0.75906675196626172,0.76652560781908141,0.77355033103433635,0.78009931259926746,0.7861288447727991,0.79159383710799969,0.79644881381145627,0.80064920105400594,0.80415287682404968,0.80692190894243776,0.80892435578856348,0.81013596088399109,0.81054155109280035],[0.0024438123720929017,0.014624955665937467,0.026800479093709306,0.038970169056985804,0.051133801104323195,0.063291139240506333,0.075441935182968822,0.087585927560668742,0.099722841050222,0.11185238544356324,0.12397425464080036,0.13608812556127015,0.14819365696504394,0.16029048817631131,0.17237823769911875,0.18445650171489802,0.19652485245003726,0.2085828364004142,0.22062997239832249,0.23266574950552876,0.24468962471429567,0.25670102043605814,0.26869932175499089,0.28068387342096257,0.29265397655321757,0.30460888502258754,0.31654780147597095,0.32846987296222119,0.34037418611331738,0.35225976182870311,0.36412554940381892,0.37597042003601422,0.38779315963205008,0.39959246083111555,0.41136691414548476,0.42311499810739617,0.43483506829519525,0.44652534509391451,0.45818390002495235,0.46980864045594051,0.48139729247483465,0.49294738168121743,0.50445621161225263,0.51592083948007561,0.52733804885106772,0.53870431884483971,0.55001578937129614,0.56126822185745562,0.57245695484156589,0.58357685373070178,0.59462225393030921,0.60558689646195729,0.6164638550922148,0.6272454539067468,0.63792317418827338,0.64848754940848763,0.65892804714246556,0.6692329367885903,0.67938914216889668,0.68938207845145527,0.69919547345605548,0.70881117438033092,0.71820894244769906,0.72736624009236672,0.73625801824406367,0.74485651524294982,0.75313108405139351,0.76104807076829029,0.76857077479341873,0.77565952872892541,0.78227194302344993,0.78836336443402188,0.7938875956987641,0.79879791284822033,0.803048392959399,0.80659552711541282,0.80940004270225707,0.81142880313715826,0.81265660453350774,0.81306766374489636],[0.0029140937509670728,0.01510105342624779,0.027282536160697313,0.039458333580427274,0.051628226710399461,0.063791985298630394,0.075949367088607445,0.088100117035287306,0.10024396645956557,0.11238063213558691,0.12450981530466465,0.13663120060893397,0.14874445493711064,0.16084922617391995,0.17294514184381471,0.18503180763858429,0.19710880581727286,0.20917569346551756,0.22123200059994075,0.23327722810154949,0.24531084546022341,0.25733228831022359,0.26934095573424832,0.28133620731081677,0.29331735987665053,0.30528368397218397,0.31723439993431113,0.3291686735958832,0.3410856115462344,0.35298425590103311,0.36486357852290785,0.37672247462646313,0.38855975569231638,0.40037414160447782,0.41216425191356343,0.423928596114717,0.43566556281347857,0.44737340763482825,0.45905023970991332,0.47069400655111648,0.48230247709867924,0.49387322269053557,0.50540359567076121,0.51689070531047943,0.52833139066750801,0.53972218995683208,0.55105930594245622,0.56233856679180638,0.573555381756226,0.58470469095527622,0.59578090844905152,0.60677785768316395,0.61768869828834916,0.62850584311604774,0.63922086430112568,0.64982438707616752,0.6603059700380598,0.67065397061565779,0.6808553946485586,0.69089572931958831,0.70075875926761388,0.71042636665004644,0.71987831736515739,0.72909203775617004,0.73804238910411479,0.74670145128780863,0.75503833233060424,0.76301902724208581,0.770606357443259,0.77776003056187404,0.78443686827169357,0.79059125500729932,0.79617585969133231,0.80114267214919221,0.80544437175551398,0.80903600575633028,0.81187690017535652,0.81393266473661763,0.81517709884690737,0.81559377639699226],[0.003378194149631808,0.015570899242570935,0.027758268786019169,0.039940099585404454,0.052116178095408805,0.064286279759095732,0.076450168296296805,0.088607594936709,0.10075829759268362,0.112901999966174,0.12503841058371834,0.13716722175269425,0.14928810843135021,0.16140072700430852,0.17350471395431355,0.18559968441998576,0.19768523062817844,0.20976092018823922,0.22182629423401601,0.23388086539779152,0.24592411559846561,0.25795549362418824,0.26997441248725051,0.28198024652632669,0.29397232822806374,0.30594994473650983,0.31791233401486163,0.32985868061945312,0.3417881110406823,0.3536996885596192,0.36559240756220457,0.37746518724512013,0.38931686463843351,0.40114618685979775,0.41295180250312158,0.42473225205096521,0.43648595718418748,0.44821120884423971,0.45990615388259082,0.47156878010766345,0.48319689951185762,0.49478812942918915,0.50633987133716651,0.51784928697408372,0.52931327139418893,0.54072842252744613,0.55209100674705969,0.56339691987590879,0.5746416429819774,0.5858201922225732,0.59692706189788991,0.60795615976751338,0.61890073357135622,0.62975328758392468,0.64050548792558704,0.6511480552690363,0.6616706435324049,0.6720617031708167,0.68230832780678563,0.69239608323549795,0.70230881838547621,0.71202845871946518,0.72153478397083592,0.7308051942122622,0.73981447126661037,0.74853454663573393,0.75693429266273504,0.76497936068234185,0.77263209834841828,0.77985158762359286,0.78659385384551683,0.79281230264465163,0.79845844193179183,0.80348293637458057,0.80783701725462287,0.81147422841030514,0.81435243027815785,0.81643591661763071,0.81769743763007796,0.81811988904908839],[0.0038361049291615323,0.01603448415895381,0.02822766768125462,0.040415457434656799,0.05259764525587618,0.064774012233765554,0.076944328013638152,0.089108350047435225,0.10126582278481011,0.11341647679969291,0.12556002784632403,0.13769617583810978,0.1498246037419303,0.16194497637973782,0.17405693912837017,0.18616011650750208,0.1982541106445167,0.2103384996037897,0.22241283556644287,0.23447664284497982,0.24652941571537645,0.2585706160470993,0.27059967070915658,0.28261596872759265,0.29461885816676636,0.30660764270327479,0.31858157785740104,0.33053986684242664,0.34248165598696112,0.35440602967949819,0.36631200477760695,0.37819852441634649,0.39006445114152521,0.40190855928310099,0.4137295264721329,0.42552592419099544,0.43729620723076956,0.44903870191147655,0.4607515928997552,0.47243290843423658,0.48408050374073608,0.49569204238688302,0.50726497528827841,0.51879651703499163,0.53028361915737277,0.54172293989292497,0.55311080995047757,0.56444319369329188,0.5757156450782952,0.58692325759394093,0.59806060733423605,0.60912168823214152,0.62009983835393534,0.63098765603144435,0.6417769044884517,0.65245840351285866,0.66302190665559191,0.67345596242852457,0.6837477580677469,0.6938829446843604,0.70384544312587893,0.71361723073176619,0.72317811053960235,0.73250546658043003,0.74157401193276029,0.750355540454126,0.75881869883919162,0.76692880304178213,0.7746477320999432,0.78193394253550541,0.78874265654712905,0.79502628490055838,0.80073514716634908,0.80581854300110745,0.81022620337924489,0.81391010640084338,0.81682657919369994,0.81893853349134438,0.82021761434196361,0.82064600170118429],[0.0042878175500602467,0.016491799322011946,0.028690723663810647,0.040884397600134625,0.053072618301050367,0.065255172450873311,0.077431835568389062,0.089602371274055015,0.10176653049934614,0.11392405063291144,0.12607465459763711,0.1382180498520883,0.15035392730909203,0.16248196016343874,0.1746018026197812,0.18671308851082558,0.19881542979477396,0.21090841491971801,0.22299160704125098,0.23506454207795402,0.24712672658758184,0.25917763544470684,0.2712167092982245,0.28324335178446503,0.29525692646860702,0.30725675348363923,0.31924210583216373,0.33121220531182405,0.34316621801998737,0.35510324938738702,0.36702233868366763,0.37892245292996884,0.3908024801447344,0.40266122183861708,0.41449738466245312,0.42630957109855172,0.43809626906969656,0.44985584032191295,0.46158650741584384,0.47328633913702556,0.48495323410691105,0.49658490234357178,0.50817884448289674,0.51973232832703298,0.53124236233591471,0.54270566561906597,0.55411863391745553,0.56547730098806448,0.57677729471607386,0.5880137871805422,0.59918143778881583,0.61027432847320795,0.62128588981234956,0.63220881680267893,0.64303497286933886,0.65375528058127919,0.66435959744013173,0.67483657507339645,0.68517350022005108,0.6953561161099141,0.70536842329135041,0.71519245977281387,0.72480806167159906,0.73419260761620775,0.74332075318591317,0.75216416599194269,0.76069127791461844,0.76886707874460158,0.7766529850563999,0.7840068291481741,0.79088302412457745,0.79723297033742191,0.80300577162938414,0.80814932192267197,0.81261179780900417,0.81634354643448215,0.81929929018844538,0.82144048865775077,0.82273762206995882,0.8231721143532803],[0.0047333235730223633,0.016942835981735072,0.029147427657776781,0.041346910663906167,0.053541087453867209,0.065729750256047881,0.077912680409554791,0.090089647648405213,0.10226040932909608,0.11442470959631723,0.12658227848101267,0.13873283092438859,0.15087606572075496,0.16301166437132719,0.1751392898402212,0.18725858520290695,0.19936917217626915,0.21147064951817307,0.22356259128303357,0.23564454491827547,0.24771602918478342,0.25977653188238103,0.2718255073590613,0.28386237378004775,0.29588651012975598,0.30789725291629766,0.31989389254425382,0.33187566931696499,0.34384176902446262,0.35579131806728448,0.36772337805967137,0.37963693984787694,0.39153091687039121,0.40340413777657358,0.41525533820830196,0.42708315163550337,0.43888609912053078,0.45066257786794772,0.46241084839493918,0.47412902013283109,0.48581503524148972,0.49746665038506044,0.50908141617885483,0.52065665397238181,0.53218942958159465,0.54367652352340945,0.55511439723630529,0.56649915469125434,0.5778264987062488,0.58909168117437738,0.60028944629917402,0.6114139658019232,0.62245876492493724,0.63341663790555724,0.64427955144358995,0.65503853454026395,0.66568355296616,0.67620336654501967,0.68658536745953591,0.69681539795296987,0.70687754620192478,0.71675391989113035,0.7264243982959695,0.73586636569219133,0.74505443194315601,0.75396015049336162,0.76255175007400389,0.77079390449895502,0.77864757509573856,0.78606997223062391,0.79301469490308729,0.79943211811218429,0.80527010260847387,0.81047509502571824,0.81499366160276154,0.81877445030282514,0.82177050341433489,0.82394175390637681,0.8252574535031818,0.82569822700537632],[0.0051726146596866585,0.017387585492287916,0.029597770694773207,0.041802987319059404,0.054003043051907951,0.066197735613331976,0.078386852108470628,0.090570168328723999,0.10274744799749713,0.11491844195542666,0.1270828872794042,0.139240506329114,0.15139100571411246,0.16353407517371166,0.17566938636106888,0.18779659152191286,0.19991532205724949,0.21202518695815287,0.22412577109936194,0.2362166333768243,0.24829730467255084,0.26036728562811817,0.27242604420586181,0.28447301301419092,0.29650758637047381,0.30852911707155062,0.32053691283804886,0.33253023239423374,0.34450828114003706,0.35647020636606985,0.3684150919557091,0.38034195251062153,0.39224972682718695,0.40413727064100091,0.41600334854476317,0.42784662497110992,0.43966565411602965,0.45145886866003315,0.46322456712281324,0.47496089966222654,0.48666585209948032,0.49833722791874091,0.50997262795023302,0.52156942740038548,0.53312474983970726,0.54463543769774581,0.55609801874348652,0.56750866794762334,0.57886316402899751,0.59015683988000767,0.60138452594403335,0.61254048548160411,0.62361834051186027,0.63461098705419794,0.64551049812693218,0.65630801279463791,0.66699360940910979,0.67755616108565353,0.68798317143539156,0.69826058869372365,0.70837259673061093,0.71830138212252037,0.72802687767949481,0.73752648478428662,0.74677477991150054,0.75574321511513465,0.76439982850184418,0.77270898910894803,0.78063121136305913,0.78812308715094004,0.79513739740229761,0.80162347754331686,0.80752791798508428,0.81279567573757106,0.81737164879407243,0.82120271456175487,0.82424015569470443,0.82644229940851111,0.82777710090340828,0.82822433965747233],[0.0056056825733824533,0.01782603931280069,0.030041743914791863,0.042252618370594019,0.054458475548347707,0.066659118606190559,0.078854340359876485,0.091043922600794858,0.10322763535983759,0.11540523611208642,0.12757646891675045,0.13974106348619419,0.15189873417721511,0.16404917889698667,0.17619207791522118,0.18832709257316793,0.20045386387897601,0.21257201097774137,0.22468112948318875,0.23678078965638139,0.24887053441510099,0.26094987715553286,0.27301829936563404,0.28507524800697071,0.29712013263886938,0.30915232225536615,0.32117114180159267,0.33317586833183677,0.34516572676646418,0.35713988519909479,0.36909744969875125,0.38103745854401416,0.392958875817352,0.40486058427754923,0.41674137741630124,0.42859995059130951,0.44043489111228429,0.45224466713774936,0.46402761521903435,0.47578192630280025,0.48750562997428271,0.49919657668945838,0.51085241770473289,0.52247058236659472,0.5340482523699045,0.54558233253093269,0.55706941754857076,0.56850575414295101,0.57988719786351273,0.59120916374697696,0.60246656987849778,0.61365377276575439,0.62476449327608907,0.6357917317127304,0.64672767042192503,0.65756356213674483,0.66828960208990018,0.67889478179088203,0.68936672229971796,0.69969148489800947,0.70985335734330623,0.7198346145195903,0.72961525344045619,0.73917270446328365,0.74848152354911734,0.75751307484815666,0.76623521925391602,0.77461203328664474,0.78260359401465929,0.790165879548267,0.79725084993912199,0.80380678765739322,0.80977898574957419,0.81511086854588521,0.81974560595785773,0.82362823018581011,0.82670818029253079,0.82894209360012272,0.83029655607342834,0.83075045230956834],[0.0060325191798702438,0.018258189008155568,0.030479338567029446,0.042695794736307691,0.054907375512896706,0.067113889438512708,0.079315134982982038,0.091510899879081564,0.10370096040446697,0.11588508060576197,0.12806301145935317,0.14023448996285581,0.15239923815054512,0.16455696202531644,0.17670735039889529,0.18885007363108686,0.20098478225779359,0.21311110549633205,0.22522864961523625,0.23733699615419712,0.24943569997806159,0.26152428714683618,0.27360225258141013,0.28566905750215399,0.29772412661464209,0.309766845013426,0.32179655477097457,0.33381255117454633,0.34581407856874546,0.35780032575576659,0.36977042089871237,0.38172342586572183,0.39365832994383476,0.40557404284130849,0.41746938688528989,0.42934308830802681,0.44119376749888739,0.45301992808092051,0.46481994464912846,0.47659204898246998,0.48833431451227527,0.5000446387954981,0.51172072370120858,0.5233600529719884,0.53495986676727925,0.54651713273201352,0.55802851305957668,0.56949032693177526,0.58089850761833617,0.59224855340291893,0.60353547137009378,0.61475371293716308,0.62589709984562192,0.63695873914060652,0.64793092546620001,0.65880502879725578,0.66957136552767826,0.68021905066328336,0.69073582876060957,0.70110788126762369,0.71131960814333506,0.72135338218640976,0.73118927556803992,0.74080475989215389,0.75017438403210202,0.75926943844380279,0.76805762113224951,0.77650272946466004,0.78456441395881338,0.79219804499639845,0.79935476021601004,0.80598177671446014,0.81202306348908881,0.81742046848722794,0.82211537174599292,0.82605088219552247,0.82917450665930326,0.83144110305452401,0.83281581032255025,0.83327656496166436],[0.0064531164480743364,0.018684026249763397,0.030910546010713635,0.043132507447672719,0.055349733632732323,0.067562038435602934,0.079769225922522558,0.091971089707852505,0.10416741225399506,0.11635796411481836,0.1285425031172428,0.14072077347508316,0.15289250482857553,0.16505741120230477,0.17721518987341778,0.18936552014109231,0.20150806198718951,0.21364245461683695,0.22576831486637094,0.23788523546454521,0.24999278313122153,0.26209049649579863,0.27417788381544206,0.28625442047064864,0.29831954621281087,0.31037266213515824,0.32241312733469496,0.33444025522843179,0.34645330948226194,0.35845149950512079,0.37043397545450829,0.38239982269185824,0.3943480556174791,0.40627761080463276,0.41818733934054964,0.43007599826849796,0.44194224100912616,0.45378460662076725,0.46560150773679154,0.47739121699286591,0.48915185172749054,0.50088135670468836,0.51257748456734165,0.52423777368238422,0.535859522983682,0.54743976335362499,0.55897522500866537,0.57046230026557798,0.58189700096224339,0.59327490968734065,0.60459112383563984,0.61584019134801427,0.62701603681693607,0.63811187643940737,0.64912012008250608,0.66003225849814795,0.67083873349515777,0.68152878866917921,0.69209029813886092,0.70250957069485831,0.71277112692080169,0.72285744731856572,0.73274869044761681,0.74242238182949083,0.75185307722728401,0.76101200834562699,0.76986672556394686,0.77838076160997316,0.7865133525938024,0.79421926865921721,0.80144882489442826,0.80814816171142323,0.81425989784686847,0.81972426060267578,0.82448077638932271,0.82847054925528218,0.83163906016263445,0.83393929234372088,0.83533485442895294,0.83580267761376026],[0.0068674664508092675,0.019103542816334862,0.031335357715920442,0.043562747650705003,0.055785540713424342,0.068003556045164504,0.080216603249806395,0.092424481762296784,0.10462698016648164,0.11682387545778883,0.12901493224553418,0.14119990188906584,0.15337852156132037,0.16555051323265357,0.17771558256700082,0.18987341772151889,0.20202368803983617,0.21416604262788186,0.22630010879996265,0.23842549038126126,0.25054176585126386,0.26264848631069615,0.27474517325237979,0.28683131611393631,0.29890636958742356,0.3109697506577529,0.32302083533801496,0.33505895506557448,0.34708339271789179,0.35909337820138032,0.37108808356010181,0.38306661754356419,0.39502801956419586,0.40697125296496306,0.41889519750588933,0.43079864096460574,0.44268026973019614,0.45453865825109041,0.46637225717614594,0.47817938000277471,0.48995818801637192,0.50170667327060936,0.51342263931745569,0.52510367934802338,0.53674715134925943,0.54835014981568553,0.55990947347818532,0.57142158842140778,0.58288258585566455,0.59428813368607059,0.60563342087893268,0.61691309346099921,0.62812118079966428,0.63925101060114176,0.65029511083056657,0.66124509650787222,0.67209153907658536,0.68282381579852025,0.69342993642838135,0.70389634432137083,0.71420768920694,0.7243465692488622,0.73429324089223003,0.74402529663952466,0.7535173136716109,0.76274048062705391,0.77166221648454569,0.7802458050396619,0.78845008154379059,0.79622922493831905,0.80353272915344354,0.81030564786268156,0.81648922395143531,0.82202201935817265,0.82684164116339731,0.83088710323906301,0.83410176179051276,0.83643662388726825,0.83785367859854221,0.83832879026585627],[0.0072755613654978957,0.01951673059464254,0.031753765264384337,0.043986506606825237,0.056214787679848555,0.068438432838273555,0.080657257163751273,0.092871065849628787,0.10507965353661386,0.11728280359463239,0.12948028734576922,0.14167186322263503,0.15385727585587039,0.16603625508380704,0.17820851487650502,0.19037375216550367,0.20253164556962033,0.21468185400598505,0.2268240151742279,0.23895774390026459,0.25108263032448319,0.26319823791723951,0.27530410130243343,0.28739972386748747,0.29948457513525129,0.3115580878701586,0.3236196548872875,0.3356686255287662,0.34770430176711131,0.35972593388950092,0.37173271571053579,0.3837237792535787,0.39569818883212682,0.40765493445264633,0.41959292444864837,0.43151097724222265,0.44340781211342906,0.45528203883948015,0.46713214604403641,0.47895648807163771,0.49075327017260528,0.50252053174890099,0.51425612737045912,0.52595770522332308,0.53762268259420543,0.5492482179293503,0.56083117892705425,0.57236810603092048,0.58385517058263237,0.59528812676635678,0.60666225632923809,0.61797230489142019,0.62921240846248794,0.640376008558035,0.6514557540607524,0.66244338769872435,0.67332961472836961,0.68410395112796363,0.69475454836040684,0.70526799160152098,0.71562906833364659,0.72582050449892277,0.73582266618063641,0.74561322630915683,0.75516679855866786,0.7644545449357294,0.77344377022667554,0.7820975262393306,0.7903742623932315,0.79822757711324599,0.80560614623335669,0.81245392805726413,0.81871076481407012,0.82431350802723735,0.82919777781498694,0.83330040876106426,0.83656252782986185,0.83893305778730431,0.84037227241992773,0.84085490291795228],[0.0076773934748829431,0.019923581580276073,0.032165760350300499,0.044403775693710235,0.056637465577094148,0.068866659510343431,0.081091177991912011,0.093310831910183523,0.10552542189687575,0.11773473762798115,0.12993855706724977,0.14213664564668693,0.15432875537791668,0.16651462388758387,0.17869397336918635,0.19086650944286065,0.20303191991365621,0.21518987341772144,0.22734001794455683,0.23948197922206305,0.25161535894948395,0.26373973286148611,0.27585464860451625,0.28795962340415815,0.30005414149946252,0.31213765131706228,0.32420956235427012,0.33626924173618877,0.3483160104070786,0.36034913891069698,0.3723678427079492,0.38437127697279516,0.39635853079879702,0.40832862073874665,0.42028048358823766,0.43221296831055767,0.44412482698453337,0.45601470463854565,0.46788112781235691,0.47972249166309666,0.49153704540201704,0.50332287581366175,0.51507788856790748,0.52679978698678398,0.53848604787071297,0.55013389392122281,0.5617402622174652,0.57330176810983025,0.58481466378323876,0.59627479061260047,0.6076775242805722,0.61901771145027085,0.63028959658023698,0.64148673723380112,0.65260190596957246,0.66362697660643355,0.67455279234239773,0.68536901288719343,0.69606393747158868,0.70662430037029955,0.71703503549837677,0.72727900683695013,0.73733670210224944,0.74718588847247602,0.75680123173291558,0.76615388444524168,0.77521105541482149,0.78393558268508379,0.79228554642058047,0.80021397697484908,0.80766873696441821,0.81459268229175819,0.82092423069294262,0.8265984780334652,0.8315489879461877,0.83571032266802847,0.83902126951680933,0.84142855164827768,0.84289062481509003,0.8433810155700483],[0.0080729551677302114,0.020324087878388686,0.032571334781117178,0.044814546406136913,0.057053565571359877,0.069288226882079251,0.081518356191497388,0.093743770018500316,0.10596427491870364,0.11817966680437419,0.13038973020835554,0.14259423748659406,0.15479294795325982,0.16698560694179287,0.17917194478443166,0.19135167570194167,0.20352449659428318,0.2156900857218691,0.22784810126582289,0.23999817975424054,0.25213993433986126,0.26427295291273067,0.27639679602936673,0.28851099463756613,0.30061504757327551,0.31270841880284572,0.32479053438041583,0.33686077908607237,0.34891849270569519,0.36096296590794985,0.37299343566757559,0.38500908017680124,0.3970090131782531,0.40899227764284574,0.42095783870467196,0.43290457575150099,0.44483127355383922,0.45673661229716023,0.46861915636040619,0.48047734165858202,0.49230946133753117,0.50411364957392857,0.51588786319217728,0.52762986076104457,0.53933717877511411,0.55100710445781131,0.56263664464190266,0.57422249008775206,0.58576097448658659,0.59724802726271242,0.60867911913175621,0.62004919918828139,0.6313526220821839,0.64258306359638917,0.65373342265697809,0.66479570749197436,0.67576090331206551,0.68661881852852713,0.69735790617603854,0.70796505691596867,0.71842535983458644,0.72872182734190072,0.7388350810093367,0.74874299644322639,0.7584203076922561,0.7678381758149575,0.77696373286706111,0.7857596226699749,0.79418357433218778,0.80218806445241131,0.80972014928075176,0.81672157707836379,0.82312931842221093,0.82887666825009543,0.83389506235264754,0.83811669348966045,0.84147789265576556,0.84392306037969556,0.84540872398524536,0.84590712822214431],[0.0084622389395252462,0.02071824170443648,0.032970480478321296,0.045218810356816186,0.057463078950842905,0.06970312590042349,0.081938782350376882,0.094169870384397059,0.1063962024136319,0.11861758051548132,0.13083379571785225,0.14304462722360245,0.15524984156930743,0.16744919171183759,0.17964241603547582,0.19182923727148049,0.20400936132104586,0.21618247597153806,0.22834824949467369,0.24050632911392411,0.25265633932686204,0.26479788006637772,0.27693052468265178,0.28905381772544503,0.30116727250359054,0.31327036839552069,0.32536254788114249,0.33744321326133087,0.34951172302664557,0.36156738783149289,0.37360946602371925,0.38563715867239867,0.39764960402818406,0.40964587134082786,0.42162495394709143,0.43358576152896333,0.44552711142654455,0.4574477188717152,0.46934618598726174,0.48122098937093349,0.49307046605417915,0.50489279759023109,0.51668599198473941,0.52844786313306824,0.54017600737019977,0.55186777667021292,0.56352024795045452,0.57513018783842296,0.58669401214422057,0.59820773914506975,0.60966693562722918,0.62106665444090869,0.63240136210151632,0.64366485471219348,0.6548501601854777,0.66594942440560678,0.676953778601038,0.68785318479985147,0.69863625584139877,0.70929004605753032,0.71979980848789293,0.7301487144743295,0.74031753187683402,0.75028425925571296,0.76002371559955428,0.76950708915876398,0.77870145550470726,0.78756928513595093,0.79606797599735968,0.80414946723528491,0.81176001771972361,0.81884026482746908,0.82532571070437677,0.83114780425375789,0.83623578031215051,0.84051936084320478,0.84393229720407759,0.8464165359800101,0.84792655735135924,0.84843324087424032],[0.0088452373931604544,0.021106035384908406,0.033363189478214483,0.045616559277218527,0.057865997126615443,0.07011134763949034,0.082352447188077438,0.094589123354031246,0.10682119433442649,0.11904846829931359,0.13127074269618522,0.14348780349621637,0.15569942437655426,0.16790536583230264,0.18010537421110451,0.19229918066241958,0.20448649999265822,0.21666702941628313,0.22884044719180463,0.24100641113023324,0.25316455696202533,0.26531449654679184,0.27745581590804658,0.28958807307297674,0.30171079569459713,0.31382347843064073,0.32592558005007688,0.33801652023417394,0.35009567603441427,0.36216237794427253,0.37421590553570983,0.38625548260410092,0.39828027175702063,0.41028936837264673,0.42228179384226994,0.43425648799820427,0.44621230061295769,0.45814798183737759,0.4700621714241684,0.48195338655804854,0.49382000808415127,0.50566026489120919,0.51747221616452288,0.52925373117445629,0.54100246620770165,0.55271583817901648,0.56439099437840556,0.5760247777102826,0.58761368666401737,0.59915382911605874,0.61064086889859737,0.62206996387425462,0.63343569402597033,0.64473197780171143,0.65595197464105115,0.66708797125314478,0.67813124881475573,0.68907192782092319,0.69989878686900897,0.71059905122713507,0.72115814669812739,0.73155941415415882,0.74178378037013115,0.75180938171463951,0.76161113930377289,0.77116028802354353,0.78042386827085097,0.789364199512399,0.79793837018569058,0.80609780038992773,0.81378796290711941,0.82094838320421926,0.82751307536415231,0.83341159752933336,0.83857090881947027,0.84291815478782572,0.84638437681863898,0.84890892729952216,0.85044411148867793,0.85095935352633623],[0.0092219432396152268,0.02148746135804902,0.033749453932680029,0.046007785018389868,0.058262311633494046,0.070512883301490525,0.082759341556768007,0.095001519410952029,0.10723924077620672,0.11947231984142082,0.13170056039675959,0.14392375510156818,0.15614168469005085,0.16835411710852688,0.18056080657734175,0.1927614925697223,0.2049558986989497,0.2171437315041963,0.22932467912421151,0.24149840984670812,0.25366457051980196,0.26582278481012667,0.27797265129029181,0.29011374133609957,0.30224559681135932,0.31436772751518682,0.32647960836327383,0.33858067627069177,0.35067032669927323,0.36274790982738336,0.37481272629382856,0.38686402246060569,0.39890098513101135,0.41092273565007131,0.42292832330310182,0.43491671791514697,0.44688680153872951,0.45883735909934564,0.47076706784693467,0.48267448543654989,0.49455803643188434,0.50641599699028617,0.51824647744635988,0.53004740246187088,0.54181648835092755,0.55355121711940636,0.56524880667409549,0.57690617655739884,0.58851990844451918,0.60008620049818051,0.61160081450690074,0.62305901453188861,0.63445549554960379,0.64578430029663081,0.65703872219584958,0.66821119186444722,0.67929314427469378,0.69027486316306053,0.7011452987782254,0.71189185455753234,0.72250013788744549,0.73295366984561994,0.74323354892119498,0.75331806445438043,0.76318225737139356,0.77279742937825013,0.78213060805886414,0.79114398556250254,0.79979436430789796,0.80803266597337975,0.81580359102864131,0.82304555445864946,0.82969106456208386,0.83566774462269278,0.84090020176305846,0.84531289512397878,0.84883401836040751,0.85140017977990423,0.85296137205456968,0.85348546617843224],[0.0095923492986283998,0.021862512174570803,0.034129266109941714,0.046392479551757959,0.058652014130897379,0.070907724217645463,0.083159456442234103,0.095407049177138825,0.1076503319775538,0.11988912497607718,0.13212323822720828,0.14435247099677451,0.15657661099085496,0.16879543351815995,0.18100870057911944,0.19321615987416541,0.20541754372279242,0.21761256788398009,0.22980093026742399,0.24198230952371691,0.25415636350015192,0.26632272754712949,0.27848101265822778,0.29063080342479208,0.30277165578337106,0.31490309453142695,0.32702461058340715,0.33913565793541156,0.35123565030224224,0.36332395738547341,0.37539990072520701,0.3874627490812379,0.39951171328127089,0.41154594046440507,0.42356450763706865,0.43556641444567146,0.44755057505507112,0.45951580900409639,0.47146083088832769,0.48338423869546499,0.49528450058917517,0.50715993990238684,0.519008718059499,0.53082881509755875,0.54261800739753463,0.55437384216645302,0.56609360812702492,0.57777430177071776,0.58941258840968735,0.60100475711870027,0.61254666848557271,0.62403369388255447,0.6354606447256872,0.64682168989832745,0.65811025917266619,0.6693189300641228,0.68043929509537904,0.69146180593225293,0.70237559029494578,0.71316823697466147,0.7238255437546538,0.7343312226496157,0.74466655681338922,0.75481000400819964,0.76473674312882023,0.77441816361449423,0.78382130365198754,0.79290825323871061,0.80163555416152676,0.80995365264437769,0.81780649328839994,0.82513138472906966,0.8318593139661844,0.83791592623789846,0.84322339903875532,0.84770339063245359,0.85128110135229118,0.85389023516762941,0.85547832370886179,0.85601157883052825],[0.0099564484993611702,0.022231180498360481,0.034502618395312323,0.046770634969928948,0.059035096403694753,0.071295861849091091,0.083552782964841033,0.09580570341402872,0.1080544583216092,0.12029887368745329,0.1325387657506446,0.14477394030027724,0.15700419192746906,0.16922930321270246,0.18144904384193017,0.19366316964411445,0.20587142154200966,0.21807352440700167,0.23026918580771794,0.24245809464084023,0.25463991963111843,0.26681430768592362,0.27898088208780181,0.291139240506329,0.30328895280808832,0.31542955864074662,0.32756056476393147,0.33968144209582496,0.35179162244001927,0.36389049485211855,0.37597740159969428,0.38805163366236306,0.40011242571079819,0.41215895049417517,0.42419031255467476,0.43620554117488564,0.44820358244895186,0.46018329035061867,0.47214341665046455,0.48408259950990973,0.49599935055031297,0.50789204016069101,0.51975888076617749,0.53159790772996252,0.54340695750242785,0.55518364256057606,0.56692532259619255,0.57862907130962049,0.59029163804405838,0.60190940334881637,0.61347832738406927,0.62499388986873183,0.6364510200206861,0.64784401463774421,0.65916644211115383,0.67041102974443367,0.68156953126416087,0.6926325708557024,0.70358945944438811,0.714427978295471,0.72513412437590463,0.73569181140374018,0.7460825202753496,0.75628489288793133,0.76627426471647853,0.77602213455958391,0.78549557567519912,0.7946566025487305,0.80346152368303914,0.81186033527349455,0.8197962453552704,0.82720546331853928,0.83401744187984639,0.84015580627527819,0.84554022559530462,0.85008943824720329,0.85372549738530812,0.85637903119823111,0.85799495002575243,0.85853769148262427],[0.010314233881052459,0.022593459107173919,0.034869503291934056,0.047142243487474866,0.05941155036304302,0.071677287787769051,0.083939312380485465,0.096197473023531876,0.10845161033715733,0.1207015561107746,0.13294713268690161,0.14518815229317061,0.15742441631726034,0.1696557145190305,0.18188182417346288,0.19410250913728089,0.20631751883126548,0.21852658712932671,0.23072943114430555,0.24292574989923454,0.25511522287137878,0.26729750839476352,0.27947224190505016,0.29163903400851188,0.30379746835443044,0.31594709928745046,0.32808744925321343,0.34021800592688212,0.35233821902987605,0.36444749679516419,0.37654520203568931,0.38863064776376566,0.40070309230145962,0.41276173381279069,0.4248057041778549,0.43683406211636544,0.44884578545327192,0.4608397624016265,0.47281478171718894,0.48476952155476827,0.49670253682721943,0.5086122448334135,0.52049690888024025,0.53235461957440555,0.54418327340076711,0.55598054813316167,0.56774387453864583,0.57947040373376446,0.59115696942827678,0.60280004414332367,0.61439568831214175,0.62593949095602863,0.6374265003693047,0.64885114293662949,0.66020712783576574,0.67148733494037893,0.68268368272372681,0.6937869723718062,0.70478670364815854,0.71567085733104641,0.72642563831190099,0.73703517279018804,0.74748115258427061,0.75774241967464206,0.76779448515534154,0.77760897950300401,0.78715303656062097,0.79638862343356098,0.8052718447079551,0.81375227455388333,0.82177240679819508,0.82926736194443995,0.83616504832435679,0.84238703080660982,0.84785039040602328,0.85247082215544867,0.85616706946729593,0.85886650124790065,0.86051123339623814,0.86106380413472028],[0.010665698593665174,0.0229493408933229,0.035229913421508274,0.047507297441710006,0.059781368047215011,0.072051993757309085,0.08431903608153446,0.096582349049033844,0.10884177869969658,0.12109716253346547,0.13334832891375692,0.14559509642051083,0.15783727314786611,0.17007465594090077,0.18230702956522071,0.19453416580246019,0.2067558224639332,0.21897174231373029,0.23118165189150441,0.24338526022397067,0.25558225741276963,0.2677723130847659,0.27995507468905323,0.2921301656228692,0.30429718316625121,0.31645569620253178,0.32860524269863012,0.34074532691545378,0.35287541631452057,0.36499493812202954,0.37710327550593759,0.38919976331498929,0.40128368332093611,0.4133542588961614,0.42541064904834369,0.43745194172136181,0.44947714625700308,0.46148518489474499,0.47347488316642716,0.48544495901836238,0.49739401046458986,0.50932050154059882,0.52122274628579413,0.53309889043384007,0.54494689043107047,0.55676448933231915,0.56854918903822371,0.58029821823519101,0.59200849527498334,0.60367658508074751,0.61529864898472308,0.62687038618337021,0.63838696523056282,0.64984294367009565,0.66123217352538921,0.67254768990693159,0.68378157945734919,0.69492482472358175,0.70596711982563498,0.71689665199511599,0.72769984272174359,0.73836104145177739,0.7488621641789498,0.75918226912079412,0.76929706242662343,0.77917832923735131,0.78879329052779434,0.79810389565919659,0.80706607674088238,0.81562901661442377,0.82373452051175644,0.83131663396136779,0.83830171407441356,0.84460922698348884,0.85015358536050356,0.85484731281784143,0.8586056713077288,0.86135257394844578,0.86302715491984894,0.86358991678681618],[0.011010835898524474,0.023298818864353588,0.035583841525016369,0.047865789293457972,0.060144541622414671,0.072419971613899237,0.084691945597754059,0.096960322676386324,0.10922495423249812,0.12148568339628063,0.13374234446814137,0.14599476229261288,0.15824275157858214,0.1704861161604414,0.18272464819411849,0.19495812728124939,0.20718631951394428,0.21940897643168811,0.23162583388088165,0.24383661076634822,0.25604100768278726,0.26823870541261308,0.28042936327486145,0.29261261730782839,0.30478807826578014,0.31695532940740989,0.329113924050633,0.34126338286475499,0.35340319086692096,0.3655327940849743,0.37765159584328789,0.38975895262163851,0.40185416942962848,0.41393649463027771,0.42600511413600539,0.43805914488796904,0.45009762751529458,0.46211951805366513,0.4741236785825188,0.48610886661610009,0.49807372305502551,0.51001675847092076,0.52193633745588697,0.53383066071964169,0.54569774455839792,0.557535397248758,0.56934119183447685,0.58111243467067453,0.59284612896503397,0.60453893240391865,0.61618710776739949,0.62778646521395576,0.6393322946448674,0.65081928623047025,0.66224143678463676,0.6735919391983991,0.68486305157683702,0.69604594205552739,0.70713050449968839,0.71810513941799337,0.72895649348354108,0.73966915011629331,0.75022526278293222,0.76060412226442975,0.77078164956539852,0.78072980811477788,0.79041593358021889,0.79980198872374619,0.80884376673744174,0.81749009263730665,0.82568211213362264,0.83335281355781099,0.84042699964515555,0.84682200187480117,0.85244948406973842,0.85721866590069951,0.86104114653138319,0.86383717276108107,0.86554269428429864,0.8661160294389123],[0.011349639168946712,0.023641886143714541,0.035931280463430193,0.048217711627808191,0.060501063383583187,0.072781213347143048,0.085058032597224553,0.097331385234884271,0.10960112790764853,0.12186710929442068,0.13412916954733434,0.14638713968632866,0.1586408409417337,0.1708900840396218,0.18313466842406378,0.19537438140974539,0.20760899725761517,0.21983827616534446,0.23206196316337657,0.2442797869061859,0.25649145834706166,0.26869666928322744,0.28089509075639174,0.29308637129185455,0.30527013495702959,0.3174459792176324,0.3296134725667762,0.34177215189873411,0.35392151959509122,0.36606104028632513,0.37819013724640638,0.39030818837163617,0.40241452168751934,0.41450841031874486,0.42658906684711984,0.43865563697024867,0.45070719235953549,0.46274272259925775,0.47476112606851095,0.48676119960409669,0.49874162675414591,0.51070096439847679,0.52263762747119646,0.53454987147243971,0.54643577239759822,0.55829320364176982,0.57011980935173867,0.58191297359429273,0.59366978458402264,0.60538699306096222,0.61706096372243469,0.62868761838694565,0.64026236929204461,0.65178004059239369,0.66323477571675671,0.67461992774987245,0.68592792941316805,0.69715013851390251,0.70827665390674732,0.71929609606600475,0.73019534532188968,0.74095922972935369,0.75157015353808254,0.76200765655588665,0.77224789476890354,0.78226303412002185,0.79202055351961365,0.80148246178182725,0.81060444890028105,0.81933501848234247,0.82761468945576722,0.83537541492737377,0.84254044422937091,0.84902494122908889,0.85473774057752294,0.85958462111145828,0.86347332781266084,0.86632021550386784,0.86805782963145472,0.86864214209100821],[0.011682101890858831,0.023978535971415083,0.036272223218413058,0.048563057154860534,0.060850925755193797,0.07313571108090744,0.085417288887243314,0.097695528198229575,0.10997029084708043,0.12224143097863427,0.13450879451014186,0.14677221854630973,0.15903153074402843,0.171286548621706,0.18353707880751691,0.19578291622022315,0.20802384317545197,0.22025962840945568,0.23249002601139701,0.24471477425408439,0.25693359431180174,0.26914618885241903,0.28135224048929441,0.29355141007656016,0.30574333482916949,0.31792762624654292,0.33010386781570733,0.3422716124664209,0.35443037974683544,0.36657965268365822,0.37871887428544737,0.39084744364143476,0.40296471156098734,0.41506997569026938,0.42716247503261828,0.43924138378730548,0.45130580440737011,0.46335475976064322,0.47538718425841187,0.48740191379276032,0.49939767429567539,0.51137306869956556,0.5233265620387193,0.53525646438296615,0.54716091123660471,0.55903784096529341,0.57088496872833239,0.58269975629019166,0.59447937695908326,0.60622067474667007,0.61792011665531343,0.6295737367698433,0.64117707055028916,0.65272507737912644,0.66421204899811848,0.67563150096071745,0.68697604360976028,0.69823722835040225,0.70940536411120303,0.72046929786643399,0.73141615194231591,0.74223100959597854,0.75289653914890087,0.76339254599755402,0.77369544152029279,0.78377761896113163,0.79360672997942328,0.80314486358821491,0.81234764449156238,0.82116329432056068,0.82953174183171108,0.83738393141564038,0.84464156458375794,0.8512176081574877,0.85701798797043782,0.86194490092752263,0.86590203592131609,0.86880161382687993,0.87057253740777796,0.87116825474310422],[0.012008217663410092,0.024308761704675774,0.036606662893010622,0.048901818710462397,0.061194121292033277,0.0734834570741566,0.085769706415215419,0.098052743185482738,0.11033243432358886,0.12260863935630384,0.13488120987806029,0.14714998898625364,0.15941481066789376,0.17167549913268587,0.18393186808703044,0.19618371994279094,0.2084308449539346,0.22067302027331226,0.23291000892089131,0.24514155865366416,0.25736740072621433,0.26958724852950089,0.28180079609378716,0.29400771643977763,0.30620765975986475,0.31840025140891037,0.33058508968111833,0.34276174334623311,0.35492974891444884,0.36708860759493678,0.37923778190767554,0.39137669190217828,0.40350471092956985,0.41562116090609258,0.4277253069962671,0.43981635163230892,0.45189342777266017,0.46395559128620889,0.4760018123293952,0.48803096556033232,0.50004181900648947,0.51203302136943685,0.52400308751044622,0.53595038181291199,0.54787309905976267,0.55976924239404768,0.57163659784588827,0.58347270480552371,0.59527482169593859,0.60703988594422353,0.61876446716176858,0.63044471221153087,0.64207628055599175,0.65365426793001369,0.6651731159542249,0.67662650478006392,0.68800722521833979,0.69930702602919326,0.71051643112414231,0.72162452033800562,0.73261866617275972,0.743484217531027,0.75420412003788251,0.7647584612971583,0.77512392872860802,0.78527316817901271,0.79517403447915191,0.80478873246284299,0.81407286166450565,0.82297440427995916,0.83143273958241071,0.83937783464417448,0.84672985386337096,0.85339954173284505,0.85928983687813154,0.86429920920763759,0.86832707866911685,0.87128127262829191,0.87308679219710017,0.87369436739520023],[0.012327980199573152,0.024632556818566798,0.036934592712330683,0.049233989256931232,0.061530642679974989,0.073824443721775213,0.086115277269532053,0.098403021961998793,0.11068754976183171,0.12296872549251714,0.13524640633642238,0.14752044129013253,0.1597906705727935,0.17205692498269654,0.18431902519677035,0.19657678100702569,0.20882999048727513,0.22107843908263503,0.23332189861339458,0.2455601261837741,0.25779286298489279,0.27001983297987608,0.28224074145745703,0.29445527343860012,0.30666309191857755,0.31886383592451961,0.33105711836565632,0.34324252365023966,0.35541960503937198,0.36758788170360057,0.37974683544303789,0.39189590702581256,0.40403449209267217,0.41616193656736788,0.42827753150279302,0.44038050728145639,0.45247002707538719,0.46454517945456775,0.47660497001394675,0.48864831186637425,0.50067401482161689,0.51268077303900306,0.52466715090201155,0.53663156681577318,0.54857227457117097,0.56048734184970972,0.57237462535875117,0.58423174198353056,0.59605603521617323,0.60784453596723664,0.61959391667525432,0.6313004373959179,0.64295988226439271,0.65456748436906254,0.66611783663719604,0.67760478579423489,0.68902130579735399,0.7003593463372646,0.71160965102637941,0.72276153872691373,0.73380264011215801,0.74471858001865343,0.7554925945122013,0.76610507003506112,0.77653299088572525,0.78674928127693988,0.7967220305011613,0.80641359627937037,0.81577959531678046,0.82476781610657679,0.83331713340383629,0.8413565736135995,0.84880478040372187,0.8555702555005964,0.86155287385501289,0.86664722967371222,0.87074824974557563,0.87375908940357228,0.8756005665332629,0.87622048004729625],[0.01264138332673681,0.024949914906638559,0.037256006024213306,0.049559561883768311,0.061860482736738165,0.074158663555377591,0.086453993680433383,0.098746356440351901,0.11103562873931794,0.12332168061112347,0.13560437473552833,0.14788356591340424,0.16015910049652782,0.17243081576741048,0.18469853926401403,0.1969620880435855,0.20922126787915551,0.22147587238144661,0.23372568203804756,0.24597046316067428,0.25820996673017538,0.2704439271275898,0.28267206073802875,0.29489406441238508,0.30710961376983159,0.31931836132172275,0.33151993439479088,0.34371393282838059,0.35589992641679946,0.36807745206360576,0.38024601060968455,0.39240506329113922,0.40455402777621841,0.41669227372247897,0.42881911778594595,0.44093381800287235,0.45303556745149098,0.46512348708545226,0.47719661761194887,0.48925391026519438,0.50129421629918092,0.51331627499150034,0.5253186999113022,0.53729996315767314,0.54925837721802129,0.56119207402712157,0.57309898072345422,0.58497679149674675,0.59682293479469506,0.60863453500208109,0.62040836751482697,0.63214080589615995,0.64382775951101756,0.65546459967457171,0.66704607190466825,0.67856619131605578,0.69001811751286479,0.70139400449803979,0.71268482009574941,0.72388012814838221,0.73496782528616911,0.74593382238090422,0.756761658941975,0.76743203684602435,0.77792225824102812,0.78820555187119046,0.79825027359162026,0.80801897247964338,0.81746732696874658,0.82654298084440692,0.83518435377974642,0.84331957378822797,0.85086578645041888,0.85772923589701122,0.86380665963384529,0.86898862424972045,0.8731653274292972,0.8762349535187719,0.87811383068973559,0.87874659269939226],[0.012948420987288212,0.025260829681540309,0.037570896299889966,0.049878529808360716,0.062183634412635302,0.074486109244106591,0.086785848020861422,0.099082738681243399,0.11137666298737836,0.12366749609577266,0.13595510609175832,0.14823935348420614,0.16052009065651318,0.17279716126941325,0.1850703996106291,0.19733962988579945,0.20960466544443868,0.22186530793391757,0.23412134637358983,0.24637255614018705,0.25861869785447456,0.27085951615785253,0.28309473836609789,0.29532407298572105,0.30754720807643543,0.31976380944094696,0.33197351862063718,0.34417595067263751,0.35637069170023661,0.36855729610441146,0.38073528351943164,0.39290413538981184,0.40506329113924067,0.41721214387429195,0.42935003555649587,0.4414762515654389,0.45359001456263637,0.4656904775505365,0.47777671600269078,0.48984771891920198,0.50190237863527631,0.51393947917908789,0.52595768293701473,0.53795551533814612,0.54993134721391779,0.56188337442050129,0.57380959422823563,0.58570777788029593,0.59757543859735629,0.6094097941504617,0.62120772293339177,0.63296571222939657,0.64467979707383793,0.65634548774975965,0.66795768350004114,0.67951056947597488,0.690997493241858,0.70241081628818547,0.71374173493860593,0.72498006373373358,0.73611397281005952,0.74712966895555866,0.75801100795034593,0.7687390236158802,0.77929135699453889,0.78964156786395645,0.79975831148733412,0.80960436811649439,0.81913552466976303,0.8282993325380148,0.8370338104036692,0.84526623616530872,0.85291228683673292,0.85987594057052252,0.866050727241098,0.8713230312428506,0.8755780731596523,0.87870874539750199,0.88062655244285726,0.88127270535148816],[0.013249087239187274,0.025565294975631314,0.037879257134632471,0.050190886376672239,0.062500090791309471,0.074806773595417209,0.087110832807297145,0.09941216089439775,0.11171064439212319,0.12400616349093985,0.13629859158867064,0.14858779480453033,0.16087363145104405,0.17315595145955698,0.18543459575452781,0.19770939557123368,0.2099801717108567,0.22224673372618564,0.23450887903032314,0.24676639191982075,0.25901904250257246,0.27126658551952598,0.28350875904782802,0.29574528307135717,0.30797585790266746,0.32020016243816152,0.33241785222573417,0.34462855732115671,0.35683187990600662,0.36902739163591147,0.38121463068316808,0.39339309843227011,0.40556225578040428,0.41772151898734178,0.42987025501015819,0.44200777624755161,0.45413333460590433,0.46624611478417943,0.47834522665680135,0.49042969661218372,0.50249845767876744,0.51455033823937424,0.52658404909714607,0.53859816861086518,0.55059112556215739,0.56256117934964178,0.57450639702257478,0.58642462656525129,0.59831346571870281,0.61017022547220134,0.62199188716627285,0.63377505191196515,0.645515880736106,0.65721002349432656,0.6688525341340078,0.68043776931492128,0.69195926667788688,0.70340959815753701,0.71478019262546133,0.72606112078291829,0.7372408335587517,0.74830584328329153,0.75924033461558149,0.77002568969350937,0.78063990950922346,0.79105691163969061,0.8012456842702198,0.81116927992742016,0.82078364293599892,0.83003628796210394,0.83886489161465505,0.84719593633263668,0.8549436676101001,0.86200979660205823,0.86828457996328479,0.8736500633504789,0.87798622995139264,0.88118033560955655,0.88313869680476986,0.88379881800358417],[0.013543376256528461,0.02586330474157772,0.038181082248390008,0.050496625063921385,0.062809845090456173,0.075120649555849739,0.087428940700583824,0.099734615439441621,0.11203756499538298,0.12433767450293154,0.13663482257807857,0.14892888085138012,0.16121971346053321,0.17350717649829384,0.18579111741110244,0.19807137434323574,0.2103477754206734,0.22262013796814994,0.23488826765204796,0.2471519575408615,0.25941098707388577,0.27166512092757622,0.28391410776761195,0.29615767887309119,0.30839554661741742,0.32062740278829782,0.33285291672677331,0.3450717332623211,0.3572834704177017,0.36948771685330883,0.38168402901619958,0.39387192795361037,0.40605089574446418,0.41822037149494451,0.43037974683544311,0.44252836084579672,0.45466549432340031,0.46679036329408374,0.47890211164809382,0.49099980276249111,0.50308240994599829,0.51514880551185849,0.52719774824740395,0.53922786900429898,0.5512376540789542,0.56322542598607228,0.5751893211467225,0.58712726391203351,0.59903693621981646,0.61091574202820009,0.62276076548006376,0.63456872151503574,0.64633589734980124,0.65805808287688394,0.6697304875672897,0.68134764087881716,0.69290327243896432,0.70439016735205584,0.71579999083068147,0.72712307492244299,0.7383481583440098,0.74946206830420514,0.76044933068536635,0.77129169211850257,0.78196753454314782,0.79245116028602847,0.80271192455121643,0.81271319444178469,0.8224111227234,0.8317532463826639,0.84067696385196333,0.84910802351903736,0.85695928460930815,0.86413019862060181,0.87050768915290733,0.87596930547477458,0.8803895206324035,0.8836495838472016,0.8856502257214327,0.88632493065568019],[0.013831282330095895,0.026154853052943405,0.038476365486415864,0.050795739475250068,0.063112890662536225,0.075427730211787503,0.087740164506738494,0.10005009482677096,0.11235741699563406,0.12466202100087764,0.13696379058111363,0.14926260277790859,0.16155832744873422,0.17385082673698915,0.18613995449463483,0.19842555565245168,0.21070746553232045,0.22298550909523418,0.23525950011796937,0.24752924029043444,0.25979451822469579,0.27205510836549163,0.28431076979069403,0.29656124488861957,0.30880625789728477,0.32104551328862418,0.33327869397828036,0.3455054593387703,0.35772544299057973,0.36993825034193106,0.38214345584353171,0.39434059991938775,0.40652918552865025,0.41870867430623548,0.43087848222142588,0.44303797468354433,0.45518646101177396,0.46732318817186236,0.47944733366531522,0.49155799743613149,0.50365419263540567,0.51573483505427353,0.52779873099952468,0.53984456334228392,0.55187087541658908,0.56387605237916372,0.57585829956120038,0.5878156172438147,0.59974577116621808,0.61164625792352667,0.62351426422170864,0.63534661872061371,0.64713973489962862,0.65888954300818348,0.67059140869449974,0.68224003531465893,0.69382934617760816,0.70535234203971786,0.71680092797614137,0.72816570226861255,0.73943569809871246,0.75059806656374795,0.76163768680342336,0.77253668586483726,0.78327384750213602,0.79382388584040642,0.8041565576854337,0.81423558812427321,0.82401739143967312,0.83344958935473468,0.84246937113449161,0.85100181964310662,0.8589584619950037,0.86623650681067332,0.87271949186205289,0.87828031232481862,0.88278764588201408,0.8861163377728688,0.88816109773029239,0.8888510433077762],[0.014112799867906367,0.026439934104767082,0.038765100819883602,0.051088223346378081,0.06340922099547408,0.075728008790202916,0.088044497177746872,0.10035859171840023,0.11267019274890888,0.12497919501770482,0.13728548728926793,0.1495889519145378,0.16188946436394203,0.17418689271921073,0.18648109711968508,0.19877192915832209,0.21105923122200787,0.2233428357701267,0.23562256454457386,0.24789822770353287,0.26016962287034584,0.27243653408766311,0.28469873066575291,0.2969559659123443,0.30920797572963332,0.32145447706207375,0.33369516617624362,0.34592971675136452,0.35815777775590107,0.37037897108198226,0.38259288890508403,0.39479909073134789,0.40699710008897649,0.41918640081312641,0.43136643286543142,0.44353658761945158,0.45569620253164556,0.46784455510350631,0.47998085602379437,0.49210424135975206,0.50421376364202386,0.51630838165882209,0.52838694873948278,0.5404481992644905,0.5524907330864639,0.56451299748215433,0.57651326617624421,0.58848961487989926,0.60043989266579478,0.61236168835060167,0.6242522908677719,0.63610864237785814,0.64792728256750654,0.65970428221506816,0.67143516362904843,0.68311480496806842,0.69473732469293437,0.70629594143921759,0.71778280337872613,0.72918877959598372,0.74050320406814008,0.7517135604280073,0.76280509274856056,0.77376032410086015,0.7845584607135303,0.79517465556346345,0.80557910202034633,0.81573592755740265,0.825601862999362,0.83512468056224232,0.84424143457145406,0.85287661836655126,0.86094049073719947,0.86832804480905157,0.87491938829118998,0.88058260578399905,0.8851802820440835,0.8885804317192918,0.89067126757119475,0.89137715595987221],[0.014387923395742352,0.026718542214129948,0.039047282346489909,0.051374070544246808,0.063698829713343175,0.076021478659389241,0.088341931812345176,0.10066009892879868,0.11297588476968856,0.12528918875109241,0.13759990456541926,0.14990791977005657,0.16221311534017291,0.17451536518199773,0.18681453560245598,0.1991104847305496,0.21140306188530789,0.22369210688448715,0.23597744928747533,0.24825890756501467,0.26053628818740238,0.27280938462172755,0.28507797622744657,0.29734182703813727,0.30960068441559918,0.32185427756052165,0.33410231586169203,0.34634448706309495,0.35858045522520787,0.37080985845323222,0.38303230636083685,0.39524737723308578,0.40745461484647305,0.41965352489717966,0.4318435709806302,0.44402417005587147,0.45619468731693169,0.46835443037974689,0.48050264267697762,0.49263849593350972,0.50476108157186872,0.51686940086828903,0.52896235364557809,0.54103872524677232,0.55309717148204507,0.56513620117807428,0.57715415588116414,0.58914918616905254,0.6011192239067169,0.61306194963243232,0.6249747540738414,0.63685469255965343,0.64869843079747191,0.66050218011507011,0.67226161978900234,0.68397180348221531,0.69562704604468351,0.7072207859513695,0.71874541740154885,0.73019208451090445,0.74155042800817095,0.75280827230832537,0.76395123768619921,0.77496225846581623,0.78582098372160325,0.79650303224027119,0.80697906917882412,0.81721366966594844,0.82716393792627785,0.8367778657057785,0.84599245191154793,0.8547316841595537,0.86290462706469939,0.87040409748890446,0.87710673904030234,0.88287567201815831,0.88756707868540252,0.8910416852199079,0.89318068574294474,0.89390326861196823],[0.01465664755767615,0.026990671820712131,0.0393229042910479,0.051653275067651161,0.063981710577040274,0.076308133329679118,0.088632461656787398,0.10095460942570933,0.11327448573178112,0.12559199456441239,0.13790703444483743,0.15021949803270185,0.16252927169832443,0.17483623505710633,0.1871402604621325,0.19944121245054369,0.211738947138711,0.224033311560627,0.23632414294322968,0.24861126791156529,0.26089450161578087,0.27317364677087363,0.28544849259891436,0.29771881366206077,0.30998436857305212,0.32224489856801342,0.33450012592421763,0.34674975220293347,0.35899345629453838,0.3712308922396379,0.38346168679590675,0.39568543671562739,0.40790170569333506,0.42011002093639438,0.43230986930354121,0.44450069294716221,0.45668188438406543,0.46885278090630667,0.48101265822784822,0.4931607232438161,0.5052961057561951,0.51741784899202248,0.52952489870638864,0.54161609062137872,0.55369013590167082,0.56574560430554455,0.57778090457359554,0.58979426152274239,0.60178368919530656,0.61374695926585288,0.62568156372401829,0.63758467061937873,0.64945307136093888,0.66128311769157322,0.6730706459838014,0.68481088589799943,0.69649834966905755,0.70812669729306488,0.71968857160873834,0.73117539562999201,0.74257712239025842,0.75388192489515238,0.76507581043239159,0.77614213936310728,0.78706102360511332,0.79780857451038012,0.808355964378764,0.81866826198618892,0.82870300350773229,0.83840847244461958,0.8477216971386361,0.85656625138678111,0.86485009088279208,0.87246390863059275,0.8792808621492485,0.88515895829748648,0.8899476558656978,0.89349990134352908,0.89568929799647623,0.89642938126406424],[0.014918967116582804,0.027256317487339476,0.03959196100606821,0.051925831047858084,0.064257857484944725,0.07658796645414867,0.088916080105597706,0.10124211633095459,0.11356598846918109,0.12588760498765084,0.13820686913617297,0.15052367857121784,0.16283792494731264,0.17514949347223308,0.18745826242219876,0.19976410261283695,0.21206687682115399,0.22436643915315935,0.23666263435111767,0.24895529703362651,0.26124425086083602,0.27352930761610661,0.28581026619423722,0.29808691148504296,0.31035901313950887,0.32262632420394055,0.33488857960544327,0.34714549446962428,0.35939676224857831,0.37164205263389527,0.38388100922554635,0.39611324692293126,0.40833834899898691,0.42055586381190158,0.43276530110143552,0.4449661278078918,0.45715776334110425,0.4693395742140305,0.48151086794021714,0.49367088607594944,0.50581879626561244,0.51795368312176793,0.53007453773857227,0.54218024559701372,0.55426957257121023,0.56634114868443053,0.57839344918861402,0.59042477244826586,0.60243321399382121,0.61441663596472762,0.6263726309804396,0.63829847924781025,0.65019109742223313,0.66204697736945273,0.67386211250173433,0.68563190875537883,0.69735107649623429,0.70901349863363639,0.7206120689236345,0.73213849276337983,0.74358304061302305,0.75493424140101095,0.7661784997302854,0.77729961627040456,0.78827818531742011,0.7990908372275991,0.80970928679103615,0.82009914298288633,0.83021843400517681,0.84001581039970286,0.8494284201227873,0.85837952342396728,0.86677606416723707,0.87450667847981578,0.88144102991417594,0.8874318695025053,0.89232160108063718,0.89595486480271835,0.89819704475384565,0.89895549391616014],[0.015174876954641814,0.027515473900516896,0.039854446972327873,0.052191732749213071,0.064527264473565382,0.076860971829308178,0.08919278070230785,0.10152261292122322,0.11385038597691388,0.1261760127183108,0.1384994010224242,0.15082045343589423,0.16313906678518808,0.17545513175221428,0.18776853241172864,0.200079145726477,0.21238684099552074,0.22469147925061828,0.23699291259489597,0.24929098347729117,0.26158552389541267,0.27387635451847592,0.28616328372085609,0.29844610651550751,0.31072460337499586,0.32299853892616315,0.33526766050243229,0.34753169653541327,0.35979035476474652,0.3720433202419221,0.38429025310007003,0.39653078605730907,0.40876452161605759,0.42099102891456308,0.43320984017963948,0.44542044672093239,0.45762229439672086,0.46981477846889108,0.48199723774988257,0.49416894792652466,0.50632911392405067,0.51847686114734459,0.53061122540450412,0.54273114127872712,0.55483542866654767,0.56692277714132322,0.57899172772768648,0.59104065158172558,0.603067724958114,0.61507089970307249,0.62704786833277992,0.63899602253009524,0.65091240360432978,0.66279364309110667,0.67463589119806688,0.68643473019571943,0.69818506906941646,0.70988101473346932,0.72151571379020918,0.73308115710254063,0.74456793722027115,0.75596494581240448,0.76725899453894053,0.77843433806667206,0.78947207204950365,0.80034937185034505,0.81103852993739478,0.82150574241691499,0.83170959092598518,0.84159917122467909,0.85111184633637049,0.86017067181643425,0.86868168934449075,0.87653156119553033,0.88358646546704267,0.88969376428167934,0.89468846583359363,0.89840633979984119,0.90070386044011963,0.90148160656825616],[0.015424372073830073,0.027768135870952282,0.040110356799427982,0.052450974569734465,0.064789925718174435,0.077127143395778419,0.089462557140179255,0.10179609262884359,0.11412767141186109,0.12645721062229764,0.13878462266188685,0.15110981485958541,0.16343268910022968,0.17575314142020215,0.18807106156665165,0.20038633251638971,0.21269882995011247,0.22500842167704738,0.23731496700451304,0.24961831604616069,0.26191830896186086,0.2742147751212588,0.28650753218194525,0.29879638507195538,0.31108112486486217,0.32336152753407787,0.33563735257104022,0.34790834144971394,0.36017421591721066,0.37243467608726488,0.38468939830969695,0.39693803278475925,0.40918020088626328,0.42141549215147223,0.43364346088872896,0.44586362234544008,0.45807544836907033,0.47027836248186161,0.48247173427564505,0.49465487301581135,0.50682702032256488,0.518987341772152,0.53113491722973438,0.54326872968761797,0.55538765233587672,0.5674904335348282,0.5795756792874307,0.59164183272082527,0.60368714997513084,0.6157096717580457,0.62770718964767758,0.63967720600273104,0.65161688605471535,0.66352300039278345,0.67539185558371606,0.68721921006503917,0.69900017166526518,0.71072907208468328,0.72239931233751675,0.73400317141246685,0.74553156812521082,0.75697376315045817,0.76831698433434581,0.7795459533760819,0.79064228561613425,0.80158372686329715,0.81234318212991108,0.82288748176641047,0.8331758233612222,0.84315782875254675,0.85277117664576862,0.86193883549247374,0.87056606767032174,0.87853766219226659,0.88571633910587688,0.89194395082526567,0.89704776178543255,0.90085406756819408,0.90320967271259944,0.90400771922035217],[0.015667447596402595,0.028014298334068988,0.040359685226339481,0.052703551041694663,0.065045835533427465,0.077386475238951813,0.089725403262910786,0.10206254904253953,0.11439783809357129,0.12673119173478686,0.13906252678908337,0.15139175525870807,0.163718783972017,0.17604351419881759,0.18836584123099331,0.20068565392471605,0.21300283420008992,0.22531725649355638,0.23762878715779401,0.24993728380316838,0.26224259457401033,0.27454455735210448,0.28684299887874132,0.29913773378549857,0.31142856352254,0.32371527517162879,0.33599764012920441,0.34827541264270834,0.36054832818083493,0.37281610161543122,0.38507842518931579,0.39733496624021292,0.4095853646461961,0.42182922995235028,0.43406613813161365,0.44629562792471456,0.45851719669452728,0.47073029571865066,0.48293432483017451,0.49512862629989129,0.50731247783296873,0.51948508452849296,0.53164556962025311,0.54379296378033437,0.55592619272178156,0.56804406278063513,0.5801452440881556,0.59222825085744901,0.60429141820020704,0.61633287475276444,0.62835051021802912,0.64034193671048145,0.65230444251129382,0.66423493648111065,0.67612988091435167,0.68798521001800705,0.69979623041555783,0.71155749905369814,0.72326267254695731,0.73490432022797025,0.74647369084060866,0.75796041974003792,0.76935215942241986,0.78063411092872781,0.79178842686535089,0.80279344823097865,0.81362272695337345,0.82424377470424381,0.83461646839429515,0.84469103922572764,0.85440558719016557,0.86368312004618342,0.87242825762147491,0.88052403538414525,0.8878297643644627,0.894181682217011,0.89939895642411016,0.90329776355770641,0.90571440156857919,0.90653383187244818],[0.01590409876536325,0.028253956350506537,0.040602427121935292,0.052949456832188768,0.065294988373969409,0.077638961589640787,0.089981313065329749,0.10232197590816938,0.11466087950504988,0.12699794926107022,0.13933310631567275,0.15166626723421672,0.16399734367247776,0.176326242011277,0.18865286295808981,0.20097710111212086,0.21329884448888581,0.22561797399984707,0.23793436288208925,0.25024787607236498,0.26255836951910605,0.27486568942513467,0.28716967141282623,0.29947013960234514,0.31176690559225217,0.32405976733026398,0.33634850786017467,0.34863289392888186,0.36091267443505326,0.37318757869814323,0.38545731452316268,0.39772156603268916,0.4099799912330121,0.42223221927583798,0.43447784737050577,0.44671643729393395,0.4589475114362892,0.47117054830928884,0.48338497743071895,0.49559017348264711,0.50778544962128547,0.51997004979270223,0.53214313987954787,0.54430379746835444,0.556450999983087,0.56858361087634712,0.58070036350215426,0.59279984220999293,0.60488046009411955,0.61694043269889587,0.62897774681209406,0.6409901232631634,0.65297497236825497,0.6649293403097265,0.67684984427980965,0.68873259362256012,0.70057309342989893,0.71236612602548255,0.72410560442211991,0.73578439005383167,0.74739406471459446,0.75892464348704192,0.77036421126372301,0.78169845993795439,0.7929100961112866,0.80397807988375658,0.81487664379196234,0.82557402763451815,0.83603085158540846,0.84619804161774903,0.85601422935973259,0.8654025971061311,0.87426727331786691,0.88248968034117092,0.88992579381179637,0.89640615132232582,0.90174146818729028,0.90573711420515257,0.90821795830881535,0.90905994452454419],[0.016134320944924285,0.028487105106609123,0.040838577485512673,0.053188686743689373,0.065537378835027305,0.07788459682470894,0.090230280694067799,0.10257436712945045,0.11491678929353477,0.12725747657738695,0.13959635433133921,0.15193334357255806,0.16426836066691441,0.1766013169824967,0.18893211851177494,0.20126066545907273,0.21358685178958536,0.22591056473570525,0.23823168425588825,0.25055008244066557,0.26286562285970361,0.27517815984300076,0.28748753768836321,0.29979358978623227,0.31209613765166477,0.32439498985182902,0.33668994081567694,0.34898076951048773,0.36126723796766957,0.37354908963751221,0.38582604754941252,0.39809781225035434,0.41036405949001908,0.42262443761567403,0.43487856463376795,0.44712602488775921,0.45936636529283736,0.47159909105756492,0.48382366080964911,0.49603948102757156,0.50824589966100597,0.52044219880006737,0.5326275862254366,0.54480118563702751,0.55696202531645578,0.5691090249260442,0.58124098008171932,0.59335654425541284,0.60545420745985901,0.61753227103897701,0.62958881772235342,0.64162167589223262,0.65362837674181962,0.66560610265591202,0.67755162469369357,0.68946122646498442,0.70133061091930859,0.71315478554927592,0.72492792016095642,0.73664316956851283,0.74829245117178589,0.75986616416351649,0.77135283280953293,0.78273865049403235,0.7940068935902711,0.80513716423660397,0.81610440840133947,0.82687764029063959,0.83741828753669822,0.847678058054957,0.85759622988640705,0.86709630380810387,0.87608208299597135,0.88443353937230085,0.89200341457408705,0.89861648516871095,0.90407466096133593,0.90817177321724107,0.91072024432887533,0.9115860571766401],[0.016358109620955186,0.028713739914904224,0.041068131447301148,0.053421235714589232,0.065773001652988605,0.078123375467690326,0.09047230044822141,0.10281971676866308,0.11516556127125088,0.12750976723173246,0.13985226410466101,0.15219297724660452,0.16453182761500595,0.17686873144017035,0.18920359986754187,0.20153633856709618,0.21386684730627781,0.22619501948246001,0.23852074161039938,0.25084389275956065,0.26316434393552302,0.27548195739889669,0.28779658591428592,0.30010807192080957,0.31241624661448486,0.32472092893140414,0.33702192441901557,0.34931902398094328,0.36161200247858261,0.37390061717012912,0.38618460596468263,0.39846368546548638,0.41073754877215773,0.42300586300676135,0.43526826652263839,0.44752436574780408,0.45977373160625246,0.47201589545030143,0.48425034442482884,0.4964765161693897,0.50869379274614401,0.52090149365952976,0.53309886780666593,0.54528508416436194,0.55745922097771339,0.569620253164557,0.58176703758685577,0.59389829576095643,0.60601259347907643,0.61810831668841226,0.63018364281405903,0.64223650650709563,0.65426455853577536,0.66626511619711692,0.67823510318303493,0.69017097625531076,0.70206863532050057,0.71392331248555496,0.72572943433001658,0.73748044983111338,0.74916861395937051,0.76078471370019285,0.7723177188488729,0.78375433397381178,0.79507841994000383,0.80627024274080195,0.81730549352709903,0.82815400639731895,0.83877808054282688,0.84913029434686182,0.85915069106126019,0.86876324239214331,0.87787160755756732,0.88635449455447413,0.89406154357547007,0.90081173877165843,0.90639783786878547,0.91060135728087743,0.9132211497042555,0.91411216982873611],[0.016575460401420217,0.028933856214567677,0.041291084268959111,0.05364709881973051,0.066001851705965842,0.078355292189390968,0.090707366779996357,0.10305801904734124,0.11540718941614814,0.12775481494464902,0.14010082908395849,0.15244516141656417,0.16478773737178654,0.17712847791582187,0.18946729921367722,0.20180411225999384,0.21413882247537575,0.22647132926441049,0.23880152553109124,0.25112929714678622,0.2634545223652609,0.27577707117852734,0.2880968046064375,0.30041357391196888,0.3127272197330011,0.32503757112007836,0.33734444446810585,0.34964764232815315,0.36194695208343142,0.37424214447107185,0.38653297192844216,0.39881916673933882,0.41110043895137516,0.42337647403111445,0.43564693021782586,0.44791143552996515,0.46016958437037758,0.47242093366646476,0.48466499846980582,0.49690124692548432,0.50912909450407784,0.5213478973681539,0.5335569447192563,0.54575544993954073,0.55794254030288104,0.57011724498142791,0.58227848101265822,0.59442503681554348,0.60655555274816608,0.61866849807709867,0.63076214357341809,0.64283452875107705,0.65488342250671305,0.66690627558727322,0.67890016287788335,0.69086171293286092,0.7027870214206543,0.71467154415401346,0.7265099640404602,0.73829602449123499,0.75002231939774899,0.76168002648599431,0.77325856636600676,0.78474516346588763,0.79612427670145935,0.80737685646858148,0.81847936957030332,0.82940251439862789,0.84010952533164174,0.85055394063381184,0.86067669109320488,0.87040237994607694,0.8796347192219014,0.88825136473233002,0.89609902249819928,0.90299088835723007,0.90871023424361397,0.91302544109776118,0.91572055152726195,0.91663828248083212],[0.01678636901680497,0.029147449571877648,0.041507431344056767,0.053866271270919808,0.066223924014346736,0.078580341808477283,0.090935474295334884,0.10328926834694374,0.11564166787262187,0.12799261360999736,0.14034204289812136,0.15268988943086848,0.1650360829886004,0.17738054914583268,0.18972320895236627,0.20206397858503944,0.21440276896690336,0.2267394853502166,0.23907402685919987,0.25140628598795567,0.26373614804836043,0.27606349056203028,0.28838818258966181,0.30071008399012067,0.31302904460056657,0.32534490332766097,0.33765748713844201,0.34996660993775897,0.3622720713171621,0.37457365515782548,0.38687112806732926,0.39916423762690134,0.41145271042188736,0.42373624982368552,0.43601453348597419,0.44828721051160714,0.46055389823882231,0.47281417858610364,0.4850675938838136,0.49731364210711626,0.50955177140816743,0.52178137382535261,0.53400177802258231,0.54621224088114839,0.55841193772889441,0.57059995094453297,0.58277525661632679,0.59493670886075956,0.60708302131394087,0.61921274519063074,0.63132424315534807,0.64341565805696832,0.65548487532887645,0.66752947753278724,0.67954668910069027,0.6915333087717821,0.70348562648248159,0.71539932048230281,0.72726932912554521,0.73908969000138747,0.75085333663530462,0.76255183967401174,0.77417507490784276,0.785710794210704,0.79714406684303529,0.8084565467304996,0.81962550530057099,0.83062254825393611,0.84141190789926013,0.85194817216068541,0.8621732846244311,0.87201264831976233,0.88137024031352695,0.89012290251983095,0.89811461246915947,0.90515282393134078,0.91101100967908633,0.91544355161953139,0.91821831194363412,0.91916439513292814],[0.016990831320531252,0.029354515680657056,0.041717168198548094,0.054078748417430544,0.066439213741329994,0.078798519292047176,0.091156617754527658,0.1035134592095085,0.11586899095221193,0.12822315729570721,0.14057589935741432,0.15292715482703856,0.16527685771403133,0.17762493807244273,0.18997132170077302,0.20231592981414104,0.21465867868575084,0.22699947925425701,0.23933823669319643,0.25167484993815137,0.2640092111667377,0.27634120522585115,0.2886707089998426,0.30099759071241661,0.3133217091540228,0.3256429128253302,0.33796103898599361,0.35027591259631474,0.36258734513751245,0.37489513329411306,0.38719905747937078,0.39949888018155633,0.41179434410532501,0.42408517007806468,0.43637105468598814,0.44865166759859909,0.46092664853280607,0.47319560379910786,0.48545810236157916,0.49771367133043087,0.50996179079013815,0.52220188784685528,0.53443332975517177,0.54665541595509182,0.55886736881399057,0.57106832282334352,0.58325731194379193,0.59543325472143038,0.60759493670886067,0.61974098961103175,0.63186986643074305,0.64397981170207919,0.6560688256585312,0.66813462086809439,0.6801745694553486,0.69218563848639758,0.70416431036937344,0.71610648415527889,0.72800735231927283,0.73986124583154833,0.75166143790683093,0.7633998934933921,0.7750669469606114,0.78665088405491512,0.79813739530630023,0.80950885572513542,0.82074336861690067,0.83181348830321677,0.84268450644359683,0.85331215018514972,0.86363950341847506,0.87359294423623801,0.88307694222262079,0.89196779134254189,0.90010698848742454,0.90729634114587909,0.9132992390167326,0.91785516133401424,0.92071427582413889,0.92169050778502415],[0.017188843289360767,0.029555050362702895,0.041920290491227363,0.05428452574649123,0.066647716193445783,0.07900981975618826,0.091370792072809293,0.10373058633828991,0.11608915313428569,0.12844644024450835,0.14080239245426118,0.15315695133252694,0.16551005499480964,0.17786163784472508,0.19021163029208876,0.20255995844497332,0.21490654377289897,0.2272513027379508,0.23959414639021892,0.25193497992347447,0.26427370218646407,0.27661020514457224,0.28894437328589351,0.30127608296491637,0.3136052016760642,0.32593158724821603,0.33825508695003237,0.350575536494385,0.36289275892841333,0.37520656339363734,0.38751674373810374,0.39982307695962771,0.41212532145576386,0.42442321505205238,0.43671647277521997,0.44900478433219604,0.46128781124882934,0.4735651836137823,0.48583649636292614,0.49810130502724104,0.51035912085221824,0.52260940517840804,0.53485156295021175,0.54708493519219847,0.55930879025774072,0.57152231361180128,0.58372459585591874,0.59591461863574025,0.60809123798576903,0.62025316455696211,0.63239894003318886,0.64452690886272257,0.65663518419776035,0.66872160663066538,0.68078369391574656,0.69281857933619939,0.70482293567041399,0.71679288076448167,0.7287238594358576,0.7406104946854668,0.75244639879511555,0.76422393156653412,0.77593388833510646,0.78756509391921159,0.79910386957253488,0.81053332722045424,0.82183242735609685,0.83297471220280339,0.84392659239992585,0.85464502302876522,0.86507435723716486,0.87514212962785654,0.88475354457938193,0.89378464256797552,0.90207473361764245,0.90942013241373454,0.91557390212687895,0.92025968042160233,0.9232082679900051,0.92421662043712016],[0.017380401023788461,0.029749049568204566,0.042116794014176118,0.054483598883760642,0.066849426821063984,0.07921423846651765,0.091577992320936663,0.10394064459837704,0.11630214906670133,0.12866245687464162,0.14102151636400828,0.15337927286553743,0.16573566847669197,0.17809064181953471,0.19044412777655484,0.20279605720208027,0.2151463566066083,0.22749494781104485,0.23984174756746457,0.25218666714255566,0.26452961185940449,0.27687048059269204,0.28920916521169382,0.30154554996469762,0.31387951079754006,0.32621091459791685,0.33853961835588708,0.35086546822956488,0.36318829850330547,0.3755079304237281,0.3878241708965946,0.40013681102481768,0.41244562446463273,0.42475036557309997,0.43705076731551018,0.44934653889576237,0.46163736306617342,0.47392289306523039,0.48620274912216821,0.49847651445557917,0.51074373067902457,0.52300389250919499,0.53525644165074526,0.54750075970547596,0.55973615992071046,0.57196187755078409,0.58417705855426338,0.59638074628486137,0.60857186575209821,0.62074920492335417,0.63291139240506333,0.64505687066804995,0.65718386375759341,0.66929033813534589,0.68137395491369179,0.69343201123030285,0.70546136782503566,0.71745835895757348,0.72941867954967288,0.74133724271827495,0.75320799849514308,0.76502370123093544,0.77677560855970318,0.78845308827869942,0.8000431002490902,0.81152950726594431,0.82289215014831552,0.83410559593222366,0.84513743158153032,0.85594592727876617,0.86647683492281002,0.87665903222719022,0.88639871468912501,0.89557199278125132,0.90401633298668982,0.91152277722932473,0.91783387231134639,0.92265644756198939,0.92570008988995212,0.92674273308921618],[0.017565500748421781,0.029936509376148779,0.042306674693193491,0.054675963593787791,0.067044341218884473,0.079411770838707985,0.091778213725750346,0.1041436290172959,0.11650797356645093,0.12887120178054945,0.14123326544566461,0.15359411353581975,0.16595369200531773,0.17831194356242897,0.19066880742245484,0.2030242190379451,0.21537810980357586,0.22773040673286327,0.24008103210354426,0.25242990306802182,0.26477693122481083,0.27712202214635662,0.28946507485797335,0.3018059812619095,0.31414462549969668,0.32648088324494884,0.33881462091762504,0.35114569480941982,0.36347395010836858,0.37579921980889541,0.38812132349135553,0.40044006595253245,0.41275523566549888,0.42506660304361288,0.43737391847908058,0.44967691012133193,0.46197528135421906,0.47426870792353859,0.4865568346572855,0.49883927171000986,0.5111155902491803,0.52338531748496453,0.53564793092454555,0.54790285170701436,0.56014943684372664,0.57238697015013862,0.58461465160635129,0.59683158482205734,0.60903676220350089,0.62122904732042017,0.63340715384296176,0.64556962025316467,0.65771477932037326,0.66984072104791248,0.68194524742605944,0.69402581683118147,0.70607947524708758,0.71810277058744276,0.73009164517530933,0.74204129975495481,0.75394602008034539,0.76579895386498131,0.77759182128028803,0.78931453565481036,0.80095470167440819,0.81249694493436586,0.82392200731887222,0.83520551487221684,0.84631628542785131,0.8572139891477355,0.86784590570187015,0.87814244644396566,0.88801106727979195,0.89732830127436525,0.90593016763674727,0.91360273165926964,0.92007790313763904,0.92504471912360164,0.92818951559911556,0.92926884574131208],[0.01774413881235104,0.030117425994712788,0.042489928588216097,0.054861615780459227,0.067232455126414736,0.079602412438996906,0.091971451670720072,0.10433953478559133,0.11670662162028544,0.12907266973354492,0.14143763424262124,0.15380146764544345,0.16616411962703892,0.17852553684856187,0.19088566271707796,0.20324443713403051,0.21560179622005737,0.22795767201352268,0.24031199213979604,0.25266467944792148,0.26501565161086782,0.27736482068504076,0.28971209262414144,0.30205736674176742,0.31440053511635391,0.32674148193112718,0.33908008274065871,0.35141620365434567,0.36374970042566246,0.37608041743428644,0.38840818654615639,0.40073282583409064,0.41305413813872549,0.42537190944611714,0.43768590705427368,0.44999587749599979,0.46230154417958169,0.47460260470175897,0.48689872777887533,0.49918954973169338,0.51147467044666151,0.52375364872085506,0.53602599687865449,0.54829117452451692,0.56054858126673279,0.57279754821025541,0.58503732797045038,0.5972670829012301,0.60948587115686514,0.62169263011198539,0.63388615654238301,0.64606508281143471,0.65822784810126589,0.67037266345772695,0.68249746906101483,0.69459988165749464,0.7066771294480807,0.71872597086068091,0.7307425924473725,0.74272247950918113,0.7546602507702993,0.76654944521692014,0.77838224466615957,0.79014910911759551,0.80183829254037375,0.81343519309168499,0.82492147183504794,0.83627384495346579,0.84746241236179098,0.85844832599755794,0.86918052072588869,0.87959113456039706,0.88958916461867565,0.89905194782959841,0.90781450830721189,0.9156583169806839,0.92230461349174442,0.92742365640892066,0.93067628697422289,0.93179495839340809],[0.017916311689506359,0.030291795761645535,0.042666551893723703,0.05504055148743181,0.067413764428431722,0.079786158984680777,0.092157701696471861,0.10452835725739262,0.11689808838531979,0.12926685568246132,0.14163461748334716,0.15400132968954483,0.16636694558972531,0.17873141566355022,0.19109468736765312,0.2034567049017858,0.21581740895295753,0.22817673641510894,0.24053462008156168,0.25289098830710743,0.26524576463619476,0.27759886739318029,0.28995020923006465,0.30229969662648959,0.31464722933601952,0.3269926997718765,0.33933599232427736,0.35167698260034452,0.3640155365761778,0.37635150964904351,0.38868474557572696,0.40101507528081548,0.4133423155160012,0.42566626734828295,0.43798671445113713,0.45030342116814293,0.46261613031305526,0.4749245606636805,0.48722840409887214,0.49952732231819408,0.51182094307185722,0.5241088558139041,0.53639060667357152,0.54866569261744214,0.56093355464721029,0.57319356984316427,0.58544504201981096,0.59768719070487275,0.60991913808267229,0.62213989345309306,0.63434833464161366,0.64654318564592739,0.65872298960881626,0.67088607594936711,0.68303052014316268,0.69515409418581808,0.70725420515937254,0.71932781848512439,0.73137136129962887,0.7433805998020484,0.75535048219923839,0.76727493573621985,0.77914660182088491,0.79095648679714636,0.80269349653048105,0.81434380919347282,0.82589002029619696,0.83730996387493617,0.84857506925695136,0.85964804803300243,0.87047961486467695,0.88100382827794332,0.89113151706001092,0.90074123089091362,0.90966750924117123,0.91768770746368689,0.92451247061454445,0.92979231055572908,0.93316010775193392,0.9343210710455041],[0.018082015979003718,0.030459615144635133,0.042836540939131251,0.055212766898550814,0.067588265155428484,0.079963006344591636,0.09233695950129861,0.10471009195095982,0.11708236918961834,0.12945375475427923,0.14182421008206325,0.15419369435705133,0.16656216434354321,0.17892957420431266,0.19129587530225256,0.20366101598362285,0.21602494134088179,0.2283875929528173,0.24074890859941933,0.25310882194857487,0.26546726221129868,0.27782415376175107,0.29017941571778583,0.30253296147717246,0.31488469820393772,0.32723452625847205,0.33958233856410058,0.35192801990171729,0.36427144612279527,0.37661248326956209,0.38895098658935001,0.40128679942800494,0.41361975198473644,0.42594965990780131,0.43827632270684669,0.45059952195346331,0.46291901923636303,0.47523455383138657,0.48754584003902901,0.49985256413302315,0.51215438085233789,0.5244509093552312,0.53674172853707836,0.54902637159274137,0.56130431967815198,0.57357499449312677,0.58583774956634294,0.59809185997139558,0.61033651013665613,0.62257077932683214,0.6347936242647505,0.64700385821988893,0.65920012570445519,0.67138087167311655,0.68354430379746844,0.69568834595108919,0.70781058045304635,0.71990817581615452,0.73197779564310439,0.74401548278016616,0.75601651068471842,0.76797519090645605,0.77988462119702384,0.79173635240276197,0.80351994297211182,0.81522235610576532,0.82682713396500696,0.83831325239003196,0.84965351301459668,0.86081226016900281,0.8717421087655135,0.88237923064857915,0.8926365840895063,0.90239436623142155,0.91148720213997958,0.91968891732208724,0.92669977086642252,0.93214960460381868,0.93564063631414596,0.93684718369760012],[0.018241248405477695,0.030620880741664469,0.042999892189167777,0.055378258338254605,0.067755953484045728,0.080132950539558045,0.092509220941653592,0.10488473454921132,0.11725945953276018,0.12963336225473365,0.14200640713939372,0.15437855653138133,0.16674977054170814,0.17912000687988006,0.19148922067066609,0.20385736425385881,0.21622438696515622,0.22859023489605457,0.24095485063037914,0.25331817295475667,0.26568013653998024,0.27804067158979928,0.29039970345318977,0.3027571521956065,0.31511293212407154,0.32746695126020786,0.33981911075445426,0.35216930423367099,0.36451741707315133,0.37686332558264624,0.38920689609434378,0.40154798393877955,0.41388643229232513,0.42622207087711517,0.43855471449096683,0.45088416134085141,0.46321019114870743,0.4755325629925905,0.48785101283915289,0.50016525071490991,0.51247495745331928,0.52477978094188416,0.53707933177768874,0.54937317822017595,0.56166084030556174,0.57394178295670217,0.58621540788370519,0.59848104402179292,0.61073793619072325,0.62298523158033725,0.6352219635637949,0.64744703220619271,0.65965918066086138,0.67185696641419024,0.68403872603180293,0.69620253164556956,0.70834613686123959,0.72046690900143617,0.73256174354272607,0.74462695513259725,0.75665813749575017,0.76864998157883657,0.78059603701356073,0.79248839574837349,0.8043172675010406,0.81607040294807986,0.82773229983728591,0.83928309565802794,0.85069700224902001,0.8619400640741911,0.87296691119045211,0.88371601842301217,0.89410277593559517,0.9040094862398218,0.91327149042220346,0.92165978689411399,0.92886461794850561,0.93449431212486023,0.93811747675938595,0.93937329634969613],[0.01839400581940509,0.030775589281354598,0.043156602244242004,0.055537022271964109,0.06791682573748814,0.08029598774285085,0.09267448203262596,0.10505228090023311,0.1174293550863853,0.12980567366889884,0.14218120394299416,0.15455591129111934,0.16692975904121077,0.17930270831217709,0.1916747178452437,0.20404574381962626,0.21641573965081173,0.22878465576950335,0.24115243937903486,0.2535190341887732,0.26588438012069149,0.27824841298591707,0.29061106412761106,0.30297226002603039,0.31533192186101888,0.32768996502649239,0.34004629859066726,0.35240082469483858,0.36475343788240899,0.37710402434856083,0.38945246109942833,0.40179861500780656,0.41414234175026921,0.42648348460799723,0.43882187311054344,0.45115732149806409,0.4634896269731158,0.47581856770774467,0.48814390056508972,0.50046535848679308,0.51278264748781566,0.52509544318833612,0.5374033867977086,0.54970608044719893,0.56200308174546998,0.57429389740226511,0.58657797572977843,0.59885469778561695,0.61112336686309288,0.62338319595991043,0.63563329275976299,0.64787264153567869,0.6601000812190807,0.67231427866057836,0.68451369581795585,0.696696549216135,0.70886075949367089,0.7210038881237758,0.73312305739208972,0.74521484830609186,0.75727516911968706,0.76929908430543259,0.78128058967482095,0.79321231328262565,0.80508511273610073,0.81688752595598257,0.82860501174716328,0.84021888465746064,0.8517047990787685,0.8630305603914592,0.87415292164164582,0.88501284484675469,0.8955284558198453,0.90558463996371019,0.91501814398105197,0.92359796816631834,0.93100489830102906,0.93682503167523934,0.94059016780477833,0.94189940900179214],[0.01854028519741302,0.030923737623293701,0.043306667840793955,0.055689055306457957,0.068070878385925071,0.080452114280610276,0.092832738948398275,0.10521272701776962,0.1175920516947192,0.1299706846617521,0.14234859596815663,0.15472575391066656,0.16710212490351695,0.179477673336777,0.19185236142170914,0.2042261490217504,0.21659899346753086,0.22897084935414735,0.24134166831867532,0.25371139879563787,0.26607998574784542,0.27844737036966682,0.29081348975938515,0.30317827655682172,0.31554165854186023,0.32790355818887096,0.34026389217128628,0.3526225708097116,0.36497949745593261,0.37733456780397723,0.38968766911797803,0.40203867936489412,0.41438746623816203,0.4267338860559724,0.43907778251502605,0.45141898527721469,0.46375730836257734,0.47609254831691716,0.48842448211645006,0.50075286476452419,0.5130774265264717,0.52539786973762514,0.5377138651058937,0.55002504741338543,0.56233101050043888,0.57463130138895435,0.58692541336849458,0.59921277782622595,0.61149275454761709,0.62376462014521727,0.63602755418274581,0.64828062244430995,0.66052275664431215,0.67275272966938515,0.68496912517096553,0.69717029995969382,0.7093543371531178,0.72151898734177222,0.73366159408593123,0.74577899871806574,0.75786741752713671,0.76992228167114196,0.78193802618958186,0.79390780862190735,0.80582312896176334,0.8176733093603068,0.82944477150409179,0.84112001765732947,0.85267617101985893,0.86408285113430627,0.87529903328187397,0.88626834293241863,0.89691194292020326,0.90711779406213666,0.91672479467736734,0.92550090982155342,0.93311825340533661,0.93914015616240931,0.94305816888643446,0.94442552165388804],[0.018680083642577339,0.031065322758355163,0.043450085851632791,0.055834354190233415,0.068218108046875114,0.080601326632258274,0.092983988022687369,0.10536606908169399,0.11774754537507881,0.13012839107871554,0.1425085788783913,0.15488807986086572,0.16726686339524099,0.17964489700362529,0.1920221462199404,0.20439857443559273,0.21677414273055995,0.22914880968825868,0.24152253119235356,0.25389526020341691,0.26626694651307525,0.27863753647295142,0.2910069726953407,0.3033751937221264,0.31574213365793813,0.32810772176297198,0.34047188200021095,0.35283453253098374,0.36519558515186479,0.37755494466481343,0.38991250817115575,0.4022681642784588,0.41462179220753059,0.42697326078458575,0.43932242730101645,0.45166913622006977,0.46401321770596671,0.47635448594643215,0.48869273723407192,0.50102774776527592,0.51335927110706492,0.52568703527212346,0.53801073932969468,0.55033004946439934,0.56264459437554626,0.57495395988502829,0.58725768259099886,0.5995552423652748,0.61184605344224363,0.6241294537825075,0.63640469231086372,0.64867091351906869,0.66092713878026088,0.67317224353154748,0.68540492922661622,0.69762368861654289,0.70982676244858989,0.72201208502793568,0.73417721518987333,0.74631924796675486,0.75843470043414452,0.77051936262338627,0.78256810058903714,0.79457459308452627,0.80653097481621616,0.81842734627982672,0.83025109005753517,0.84198590174110766,0.85361039297568486,0.86509604225545222,0.87640413615416268,0.88748112923290812,0.89825151612013565,0.90860683483297433,0.91838893285288925,0.9273658420797769,0.93520204874445223,0.94143783600907915,0.94552084260995395,0.94695163430598406],[0.018813398384708635,0.03120034180900122,0.043586853286261884,0.055972915813852775,0.068358511485576479,0.080743621430893198,0.093128225749166793,0.10551230343846207,0.11789583231835687,0.13027878894617628,0.14266114852598577,0.1550428848096016,0.16742396998879083,0.17980437457773635,0.19218406728472048,0.20456301487186135,0.21694118200158485,0.22931853106834454,0.2416950220139128,0.25407061212434268,0.26644525580644485,0.27881890434133116,0.2911915056122345,0.30356300380342327,0.31593333906656673,0.32830244715037882,0.34067025898874437,0.35303670024180189,0.36540169078360352,0.37776514412896378,0.39012696679092629,0.40248705755885983,0.41484530668553199,0.42720159496950749,0.43955579271683987,0.45190775856315013,0.46425733813374803,0.47660436251526606,0.48894864650721104,0.50128998661564972,0.51362815874366974,0.52596291552392904,0.53829398322707434,0.55062105816547735,0.56294380249382536,0.57526183928560892,0.58757474673611654,0.59988205130641847,0.61218321957657973,0.62447764851681331,0.63676465380805336,0.64904345574252154,0.66131316210197033,0.67357274723481209,0.68582102631694775,0.69805662346146558,0.7102779319059509,0.7224830639039459,0.73466978710701525,0.74683544303797467,0.75897684156088396,0.77109012279850697,0.78317057434221526,0.79521238622413293,0.80720831798236381,0.81914923962390507,0.83102348868472642,0.84281595437768941,0.85450674931681825,0.86606924638168992,0.87746712070050548,0.88864980813520233,0.89954541861379955,0.91004957149144317,0.92000790519985143,0.92918976171198375,0.93725333923990783,0.94371593475125259,0.94797743240135923,0.94947774695808007],[0.018940226780624458,0.03132879202957406,0.043716967291188236,0.056104737210273425,0.068492085615340259,0.080878995463667502,0.093265448781870819,0.10565142660154381,0.11803690888948626,0.13042187447198417,0.14280630095253866,0.155190164622376,0.16757344036298683,0.17995610153985886,0.19233811988645588,0.20471946537738606,0.21710010608956976,0.22948000805005575,0.24185913506897161,0.25423744855588215,0.26661490731760851,0.27899146733528457,0.29136708151812563,0.30374169943102403,0.31611526699267178,0.32848772614042454,0.34085901445756139,0.35322906475792837,0.3655978046221805,0.37796515587891932,0.39033103402295133,0.40269534756160064,0.4150579972785019,0.42741887540247714,0.43977786466693625,0.45213483724263137,0.46448965352345883,0.47684216074119756,0.48919219138045722,0.50153956135947286,0.51388406793547614,0.52622548728486729,0.53856357169788915,0.55089804631442174,0.56322860531114882,0.57555490742979276,0.58787657071010102,0.60019316625819497,0.61250421083852369,0.62480915802308035,0.63710738756062946,0.64939819253597775,0.66168076376703899,0.67395417072485697,0.6862173380436325,0.69846901639237968,0.71070774607573617,0.7229318111727201,0.73513918124093069,0.74732743650790567,0.759493670886076,0.77163436484380898,0.78374521676741415,0.79582091636041263,0.80785483587902285,0.81983860300136546,0.83176150019639183,0.84360960503251958,0.85536453604234175,0.86700158570623342,0.87848688157522914,0.8897729766880409,0.90079186343164852,0.91144374088320523,0.92157891437627337,0.93096941774623687,0.93926883109613324,0.94597197541263278,0.9504270337840971,0.95200385961017608],[0.019060566314411775,0.031450670806574599,0.043840425150219908,0.056229815555165374,0.068618827497888168,0.081007445672149681,0.093395653935581247,0.10578343525183787,0.11817077162788348,0.13055764404592773,0.14294403238947129,0.15532991536285701,0.1677152704036533,0.18010007358711388,0.19248429952186374,0.20486792123586117,0.21725091005155872,0.22963323544905434,0.24201486491586266,0.25439576378175621,0.26677589503691979,0.27915521913141661,0.29153369375369098,0.30391127358550862,0.31628791003035883,0.32866355091190846,0.3410381401385908,0.35341161732980841,0.36578391739853588,0.37815497008427645,0.39052469942935852,0.40289302319039411,0.41525985217535544,0.42762508949508093,0.43998862971606756,0.45235035789904143,0.46471014850496628,0.47706786414670499,0.48942335416036742,0.50177645296528106,0.51412697817525332,0.52647472841609444,0.53881948079482034,0.55116098795408464,0.56349897463053511,0.57583313361710831,0.5881631210056385,0.60048855055606043,0.61280898699992359,0.6251239380361826,0.63743284471256734,0.64973506980117268,0.66202988366513194,0.67431644696444093,0.68659378934907167,0.69886078301634458,0.71111610963791905,0.72335821864696692,0.73558527415464436,0.74779508674132367,0.75998502489635111,0.77215189873417733,0.78429180543817356,0.79639992110499647,0.80847021634944793,0.8204950616315817,0.83246467015486336,0.84436629681128006,0.85618306301274139,0.86789219502691584,0.87946232174352101,0.8908492299689772,0.90198903994187829,0.91278701381725913,0.92309902080887452,0.93270129855306561,0.94124484017058552,0.94820307566116291,0.95286855710257623,0.9545299722622721],[0.019174414597674327,0.031565975658926715,0.043957224284747576,0.056348148167212342,0.068738734343674723,0.08112896915266754,0.093518838186195663,0.10590832623806634,0.11829741724787113,0.13068609424018773,0.1430743392585142,0.15546213329340253,0.16784945620418168,0.18023628663360047,0.19262260191462688,0.20500837796855187,0.21739358919344065,0.22977820834184093,0.2421622063865313,0.25454555237291465,0.26692821325648997,0.2793101537236089,0.29169133599348007,0.30407171959909496,0.31645126114441047,0.32882991403473605,0.34120762817681338,0.35358434964454466,0.36596002030569141,0.37833457740413179,0.39070795309138828,0.40308007390009226,0.41545086015083432,0.42782022528236252,0.44018807509334001,0.4525543068817508,0.46491880846549327,0.47728145706460612,0.48964211802181234,0.50200064333347871,0.51435686995745211,0.52671061785729467,0.53906168773384522,0.55140985838433154,0.56375488361586623,0.57609648862330221,0.58843436572008523,0.60076816928354815,0.61309750974123001,0.62542194637978032,0.63774097869944835,0.6500540359604049,0.66236046446570207,0.67465951199047169,0.68695030858506456,0.69923184273274319,0.71150293150338073,0.72376218287390204,0.73600794772515066,0.74823825808469491,0.76045074682976488,0.77264254208218108,0.78481012658227844,0.79694914788047833,0.80905415834420613,0.8211182532535477,0.83313255809855846,0.84508548812765538,0.85696165624277754,0.86874022491555669,0.88039235685009642,0.89187716698690589,0.90313512137040097,0.91407700319865948,0.92456514717343097,0.93438162119607171,0.94317724727723706,0.95040586938582916,0.95530067864043877,0.95705608491436811],[0.019281769369769886,0.031674704238229268,0.044067362254013864,0.056459732508398086,0.068851803512193221,0.081243563156636389,0.09363499867107683,0.10602609657714812,0.11841684263907981,0.13080722180976778,0.14319721817217101,0.15558681487555814,0.16797599406606623,0.18036473681097476,0.19275302301601549,0.20514083133496708,0.21752813907067581,0.22991492206654274,0.24230115458738843,0.25468680918846121,0.26707185657119381,0.2794562654241155,0.29184000224710827,0.30422303115694105,0.31660531367171041,0.3289868084714771,0.34136747113197186,0.35374725382777628,0.36612610500081821,0.37850396898936378,0.39088078561191286,0.40325648969947414,0.41563101056860163,0.42800427142626252,0.44037618869603634,0.45274667125325341,0.46511561955441083,0.47748292464343756,0.48984846701402907,0.50221211530317111,0.51457372478593888,0.52693313563545985,0.53929017090423859,0.55164463417347187,0.56399630680499868,0.57634494471543429,0.58869027457291634,0.60103198929251977,0.61336974267510835,0.62570314299397789,0.63803174528101514,0.65035504199506045,0.66267245166383049,0.67498330496887948,0.6872868275789128,0.69958211881345067,0.71186812491184281,0.72414360525580357,0.73640708929305176,0.74865682105355813,0.76089068691267625,0.77310612044057425,0.78529997547226649,0.79746835443037978,0.80960637259531532,0.82170782902848405,0.83376473876639368,0.84576665438589105,0.85769966024115152,0.86954484500069373,0.88127591983700593,0.892855397105352,0.9042282733652498,0.91531127412696811,0.92597408608034271,0.93600632415988116,0.94506145125991547,0.95257641196567033,0.9577217758097657,0.95958219756646401],[0.019382628498033516,0.031776854328994353,0.044170836755366927,0.056564566184277631,0.06895803251226551,0.081351225090867341,0.093744132689384863,0.10613674345455559,0.11852904486682858,0.13092102369290348,0.14331266593415615,0.15570395677052862,0.16809488049941224,0.18048542046899541,0.19287555900547892,0.20526527733349664,0.21765455548898593,0.23004337222365878,0.24243170490011856,0.25481952937653174,0.26720681987962447,0.27959354886460164,0.29197968686038955,0.30436520229838149,0.31675006132259487,0.32913422757884669,0.34151766198019362,0.35390032244546266,0.36628216360720112,0.37866313648479688,0.39104318811782968,0.40342226115389601,0.4158002933841799,0.4281772172188858,0.44055295909325709,0.45292743879323361,0.46530056868779224,0.47767225285256754,0.4900423860663784,0.50241085265866192,0.51477752518135156,0.52714226287324562,0.53950490987809419,0.55186529316914501,0.56422322012225412,0.57657847566626352,0.58893081892236254,0.60127997922248677,0.6136256513689754,0.62596748996173734,0.63830510257228612,0.65063804148245841,0.66296579362410801,0.6752877682471925,0.68760328169681872,0.6999115384798138,0.7122116075260263,0.72450239216609802,0.7367825918068911,0.74905065251362046,0.76130470258920402,0.77354246759609935,0.78576115680590064,0.79795730931787023,0.81012658227848111,0.82226345443136128,0.8343608033153328,0.8464092896680997,0.85839644038224083,0.8703052473427334,0.88211196578326712,0.89378254695960579,0.90526666361022712,0.91648735610140175,0.92732251151438261,0.93757106481392827,0.9468923212839877,0.95471006620686727,0.96012984021080117,0.96210831021856003],[0.01947698997798919,0.031872423848873122,0.04426764562450114,0.056662646944233952,0.069057419002315434,0.081451952517861526,0.093846237702389756,0.10624026422464883,0.11863402117248467,0.13102749701144767,0.14342067953980964,0.15581355583962375,0.16820611222341519,0.18059833417604165,0.19299020629120189,0.20538171220201418,0.21777283450500451,0.23016355467676508,0.24255385298244481,0.25494370837512381,0.26733309838499464,0.2797219989971248,0.29211038451640592,0.30449822741809607,0.31688549818213008,0.32927216510910373,0.34165819411552689,0.35404354850557007,0.36642818871609439,0.37881207203125,0.39119515226232338,0.40357737938779603,0.41595869914773242,0.42833905258559424,0.44071837552936755,0.45309659800241697,0.46547364355272713,0.47784942848703993,0.49022386099379722,0.50259684013561134,0.5149682546880745,0.52733798179689395,0.53970588541935394,0.55207181450864795,0.56443560089027467,0.57679705676790993,0.58915597178121448,0.6015121095189726,0.61386520336643158,0.62621495153401097,0.63856101107317831,0.65090299063095491,0.66324044162247442,0.67557284740470991,0.68789960990444776,0.70022003297626623,0.71253330152180649,0.72483845506066591,0.73713435396176918,0.74941963585500493,0.76169265874248226,0.77395142585350718,0.78619348507506936,0.79841579241102867,0.81061452366021003,0.82278481012658222,0.83492036052395635,0.84701290841559074,0.85905138529372149,0.8710206498774774,0.88289947693249071,0.89465726782740518,0.90624847246718288,0.91760275743610853,0.92860699457386775,0.93907122322198289,0.94866415063718268,0.95680136582963482,0.96252235956180088,0.96463442287065604],[0.019564851933548177,0.031961410848866501,0.044357786835682367,0.056753972681718667,0.069149960790626963,0.081545743156084094,0.093941311333766375,0.10633665641099133,0.11873176897380155,0.13112663907123356,0.14352125617648714,0.15591560914467739,0.16830968616681208,0.18070347471959891,0.19309696151063005,0.20549013241844294,0.2178829724268907,0.23027546555317924,0.24266759476884869,0.2550593419128786,0.26745068759598667,0.27984161109506001,0.29223209023651564,0.30462210126720946,0.31701161871131556,0.3294006152113691,0.34178906135138554,0.35417692545966073,0.36656417338847203,0.37895076826746676,0.39133667022699936,0.40372183608705758,0.41610621900668454,0.42848976808792238,0.44087242792724801,0.45325413810620319,0.46563483261138938,0.4780144391721437,0.49039287850194613,0.50277006342684927,0.51514589788082277,0.52752027574371585,0.53989307949234044,0.55226417862869637,0.56463342784123061,0.57700066484477242,0.58936570783177511,0.60172835245089296,0.61408836820755441,0.62644549415355377,0.63879943369659009,0.65114984831324496,0.66349634988593831,0.67583849130017226,0.68817575482452176,0.70050753764040774,0.71283313367414158,0.72515171058407146,0.73746228033184025,0.74976366115909698,0.7620544279069521,0.77433284630872112,0.78659678492158214,0.79884359535243643,0.81106994672654653,0.82327159282296369,0.83544303797468356,0.84757704709290904,0.8596639092425622,0.8716902999010242,0.88363746786811004,0.89547824339857318,0.90717190459673636,0.9186549819374682,0.92982402401650122,0.94050191413897177,0.95037061544545676,0.95884385373184344,0.96489615527786454,0.96716053552275205],[0.019646212617195902,0.032043813513524921,0.044441258501960013,0.056838541434477974,0.069235655835584664,0.081632594880222897,0.09402935136987034,0.10642591770664622,0.1188222858652358,0.13121844736241473,0.14361439322392544,0.15601011394844078,0.16840559946830469,0.18080083910671529,0.19319582153096115,0.20559053470128741,0.21798496581490279,0.23037910124458161,0.24277292647124427,0.25516642600981232,0.26755958332754759,0.27995238075396589,0.29234479938129843,0.3047368189543227,0.3171284177482121,0.32951957243286112,0.34191025792190533,0.35430044720438303,0.36669011115666861,0.37907921833192537,0.39146773472388541,0.40385562350122528,0.41624284470818451,0.42862935492631415,0.44101510689134593,0.45340004905807596,0.46578412510485911,0.47816727336770581,0.49054942619204434,0.50293050918783755,0.51531044037083229,0.52768912916912736,0.54006647526977902,0.55244236727460572,0.56481668112736683,0.57718927826569066,0.58956000343993997,0.60192868212692952,0.61429511744802734,0.62665908647737845,0.63902033579489959,0.65137857609780336,0.66373347563010388,0.67608465211683555,0.68843166279132317,0.70077399196938983,0.71311103543855769,0.7254420806704257,0.73776628149629531,0.75008262535745496,0.76238989047094208,0.77468658911008803,0.78697089147835109,0.79924052201089646,0.81149261579016863,0.82372351610309624,0.83592848320709523,0.84810126582278478,0.8602334545007182,0.87231347756629862,0.8843249907894184,0.89624419787418674,0.90803520147403993,0.91964154782901397,0.9309700320370955,0.94185800921150609,0.9520047431199109,0.96082989344705694,0.96724715606243006,0.96968664817484806],[0.019721070410164576,0.032119630161131396,0.044518058875363531,0.05691635138476292,0.069314502245898524,0.081712505721428186,0.094110355759994824,0.1065080459744504,0.11890556961824272,0.13130291955978213,0.14370008825458203,0.15609706771494791,0.16849384947695378,0.1808904245644255,0.19328678344960404,0.20568291601012911,0.21807881148193464,0.23047445840759573,0.2428698445796067,0.255264956977999,0.26765978170163229,0.28005430389239294,0.29244850765143615,0.3048423759464769,0.31723589050899459,0.32962903172004954,0.3420217784832098,0.35441410808286344,0.36680599602591157,0.37919741586452949,0.39158833899729972,0.40397873444557542,0.41636856860140059,0.42875780494268023,0.44114640371052583,0.45353432154278994,0.46592151105669311,0.47830792037210312,0.49069349256539008,0.50307816504177683,0.51546186881164691,0.52784452765322909,0.54022605714030514,0.55260636350888481,0.56498534233087605,0.57736287695533328,0.58973883666838844,0.60211307451087526,0.61448542467707368,0.62685569939781904,0.63922368518483341,0.65158913827841092,0.66395177909443548,0.67631128540485586,0.68866728390198872,0.70101933968244712,0.71336694302798631,0.7257094926386074,0.73804627415845858,0.75037643238226215,0.76269893486881246,0.77501252370669282,0.78731565069447718,0.79960638891311298,0.81188231007260869,0.82414031122215492,0.83637636483469269,0.84858514997984691,0.86075949367088622,0.87288949935903282,0.88496114083557109,0.89695390431095368,0.9088366546801534,0.92056000882866473,0.93204142556715319,0.94313417146620937,0.95355889703106833,0.9627504549107766,0.96957007808120466,0.97221276082694408],[0.019789423822594632,0.032188859243874712,0.044588186347086056,0.056987400859524362,0.069386498280813225,0.081785473867536096,0.094184322616609584,0.10658303924727164,0.11898161818154973,0.13138005352305782,0.14377833903395199,0.15617646810985619,0.16857443375254444,0.18097222854014627,0.19336984459460416,0.20576727354608526,0.21816450649401242,0.23056153396432633,0.24295834586255671,0.255354931422205,0.2677512791478921,0.28014737675263401,0.29254321108853076,0.30493876807004494,0.31733403258892934,0.32972898841972453,0.34212361811458403,0.35451790288599616,0.36691182247574283,0.37930535500817686,0.39169847682558612,0.4040911623030371,0.41648338363965554,0.42887511062277084,0.44126631036071762,0.45365694697933034,0.46604698127624244,0.47843637032599062,0.49082506702756101,0.50321301958435449,0.51560017090450061,0.52798645790692644,0.5403718107154466,0.55275615171923098,0.56513939447308814,0.57752144240480074,0.58990218728886812,0.60228150743593067,0.61465926553417227,0.62703530606217139,0.63940945217066558,0.6517815019017118,0.66415122357518941,0.67651835012090089,0.688882572064482,0.70124352877942986,0.7136007974847538,0.72595387928157507,0.73830218125763292,0.75064499330782486,0.76298145776196447,0.77531052908273868,0.78763091964280441,0.79994102565320935,0.81223882425840666,0.82452172787126077,0.83678637361740615,0.84902831173073279,0.86124153195197306,0.87341772151898733,0.88554506139925349,0.89760619311206646,0.90957461981195253,0.92140797718884482,0.93303462319084496,0.94432490406760117,0.95502478574572158,0.96459488085599177,0.97185796737562635,0.97473887347904009],[0.019851271493682709,0.032251499348006196,0.044651639447651603,0.057051688330593153,0.069451642350298659,0.081851497663273043,0.094251250215580007,0.10665089572824249,0.11905042968140889,0.13144984729716647,0.14384914352085854,0.15624831300075848,0.16864735006592313,0.18104624870203823,0.19344500252503383,0.2058436047522324,0.2182420481707521,0.23064032510285548,0.24303842736789749,0.25543634624047196,0.26783407240430956,0.28023159590141511,0.29262890607585845,0.30502599151155574,0.31742283996327392,0.32981943827998461,0.34221577231955835,0.35461182685363546,0.3670075854613305,0.37940303041020662,0.39179814252271339,0.40419290102596561,0.41658728338239404,0.42898126509836665,0.44137481950735924,0.45376791752364476,0.46616052736171443,0.47855261421574213,0.49094413989229313,0.5033350623881282,0.51572533540328735,0.52811490777758274,0.54050372283607484,0.55289171762591893,0.56527882202296387,0.57766495768142856,0.59005003679355694,0.60243396061793064,0.61481661772452711,0.62719788189087811,0.6395776095657083,0.65195563679275448,0.66433177545595423,0.67670580866490426,0.68907748504213839,0.70144651159519711,0.71381254474754052,0.72617517894952077,0.73853393207335249,0.75088822648264053,0.76323736420804722,0.77558049397704243,0.78791656680855415,0.80024427527803033,0.8125619690180913,0.82486753490058629,0.83715822348222058,0.84943039150817223,0.86167910932348357,0.87389754337066183,0.88607594936708867,0.89819996055249829,0.9102475308157908,0.92218314840564009,0.93394609751345792,0.94542461498448871,0.95639350690862956,0.9663506492765328,0.97410153783058151,0.97726498613113599],[0.019906612191816664,0.032307549193984042,0.044708416847069832,0.057109212414843569,0.069509933015226566,0.081910575610443903,0.094311136996368061,0.1067116137909756,0.11911200242182785,0.13151229911248197,0.14391249986771837,0.15631260045746942,0.1687125963993058,0.18111248293933824,0.19351225503135239,0.20591190731399323,0.21831143408577836,0.23071082927769504,0.24311008642310639,0.25550919862465049,0.26790815851777905,0.28030695823052765,0.29270558933905866,0.30510404281844616,0.31750230898810061,0.32990037745113832,0.34229823702689777,0.35469587567568317,0.3670932804146676,0.37949043722372289,0.39188733093974015,0.404283945137764,0.4166802619969846,0.42907626214928363,0.44147192450763306,0.45386722607114349,0.46626214170297553,0.47865664387660189,0.49105070238503234,0.50344428400654162,0.51583735211911463,0.5282298662541991,0.54062178157831819,0.55301304828857401,0.56540361090488389,0.57779340743777907,0.59018236840548743,0.60257041566748359,0.61495746103327131,0.62734340459423066,0.63972813271205775,0.65211151557847069,0.66449340423573855,0.67687362691388819,0.68925198449468195,0.70162824484973707,0.71400213571313131,0.72637333562662665,0.73874146232171878,0.75110605765158556,0.76346656781772992,0.77582231708673599,0.78817247235771715,0.80051599464626,0.81285157149698894,0.82517752099753017,0.8374916524844398,0.84979105940672528,0.86207180262790184,0.87432841052677901,0.88655306022028713,0.89873417721518989,0.91085391451424202,0.92288332719294552,0.93477242250034687,0.94642769855267606,0.957655637063484,0.96800316207994053,0.97628820598283517,0.97979109878323201],[0.019955444814698353,0.032357007636603985,0.044758517354975158,0.057159971874342741,0.069561368987528627,0.081962706368101768,0.094363981562214261,0.10676519197975887,0.11916633488477768,0.13156740738505157,0.14396840642078346,0.15636932875228426,0.16877017094655633,0.18117092936266033,0.19357160013572927,0.20597217915948696,0.21837266206710371,0.2307730442101984,0.24317332063578045,0.2555734860608847,0.26797353484463204,0.28037346095740101,0.29277325794675846,0.30517291889974407,0.31757243640104349,0.32997180248652169,0.34237100859150027,0.354770045493076,0.36716890324566043,0.37956757110879491,0.39196603746614045,0.40436428973435423,0.41676231426035215,0.42916009620519058,0.44155761941249405,0.4539548662589683,0.46635181748409527,0.47874845199554361,0.49114474664615815,0.50354067597756824,0.51593621192443662,0.52833132347211709,0.54072597625893071,0.55312013211232447,0.56551374850572378,0.57790677791981193,0.59029916708802088,0.60269085610100714,0.61508177733838254,0.62747185418756191,0.63986099949856245,0.65224911370904815,0.66463608255455187,0.67702177425278509,0.68940603601562511,0.70178868969389807,0.71416952629279717,0.72654829900120843,0.73892471424351991,0.75129842006780567,0.76366899089844698,0.77603590725432403,0.78839852838395497,0.8007560547594863,0.81310747576700548,0.82545149531547735,0.83778642370235501,0.85011001648813311,0.86241922753033307,0.87470981792750246,0.8869757129267537,0.89920789620551433,0.91139240506329111,0.92350645420779542,0.93551032493873876,0.94732863391370259,0.95880137871805426,0.96953561161099144,0.97840068291481741,0.98231721143532802],[0.019997768389453219,0.032399873665116097,0.044801939920750544,0.057203965616482777,0.069605949130338796,0.082007888752699487,0.094409782680299981,0.10681162900972963,0.11921342573038074,0.13161517071679751,0.14401686172035555,0.15641849636021099,0.16882007211343641,0.18122158630426421,0.19362303609233478,0.20602441845984343,0.21842573019746725,0.2308269678889272,0.24322812789403503,0.25562920633004427,0.26803019905110903,0.28043110162561558,0.29283190931113268,0.3052326170266787,0.31763321932196631,0.3300337103432317,0.34243408379520113,0.35483433289867083,0.36723445034310198,0.37963442823353244,0.3920342580309949,0.40443393048549492,0.41683343556044272,0.42923276234723917,0.44163189896848798,0.45403083246802556,0.46642954868562647,0.47882803211383473,0.49122626573387396,0.50362423082698138,0.51602190675676252,0.52841927071723904,0.54081629744011139,0.55321295885332311,0.56560922368120736,0.57800505697422033,0.59040041955335765,0.60279526735064382,0.61518955062229086,0.62758321300490616,0.63997619037698295,0.65236840947716146,0.6647597862164305,0.67715022360219157,0.6895396091659628,0.7019278117506127,0.71431467746315713,0.72670002452903804,0.73908363668385291,0.75146525459391877,0.76384456458456362,0.77622118363730286,0.78859463913284533,0.80096434106346481,0.81332954323868922,0.82568928804890163,0.83804232605841777,0.85038699598469492,0.86272104033521291,0.87504131267872753,0.88734329455504413,0.89962026100544823,0.91186175805154812,0.92405063291139244,0.93615673878314931,0.94812209893709343,0.95982077391450704,0.97092900460575304,0.98041494672352847,0.98484332408742403],[0.020033582072727429,0.03243614640332837,0.044838683633638965,0.057241192694099441,0.069643672458118977,0.082046121738224564,0.094448539281891897,0.10685092376702809,0.11925327379707529,0.13165558789569276,0.14405786450097757,0.15646010195917504,0.16886229851782608,0.1812644523182938,0.19366656138759675,0.2060686236294802,0.21847063681463619,0.23087259856997722,0.24327450636685621,0.25567635750810791,0.26807814911377503,0.28047987810535613,0.29288154118839727,0.30528313483322156,0.31768465525355361,0.3300860983827737,0.34248745984748352,0.35488873493802542,0.36728991857553406,0.37969100527503685,0.39209198910404131,0.40449286363594739,0.41689362189751822,0.42929425630950468,0.44169475861935981,0.45409511982478545,0.46649533008662203,0.4788953786293042,0.49129525362676563,0.50369494207124577,0.51609442962193741,0.52849370042976229,0.54089273693376805,0.55329151962363587,0.56569002676152891,0.57808823405492804,0.59048611427007314,0.60288363677304269,0.61528076698216316,0.62767746571110261,0.64007368837631695,0.65246938403502264,0.66486449420986227,0.67725895144299808,0.68965267750408854,0.70204558115151849,0.71443755531138553,0.72682847348966517,0.73921818516299531,0.75160650979217725,0.76399322895346322,0.7763780758596156,0.78876072120240037,0.80114075371796545,0.8135176530310857,0.82589075095085585,0.83825917506045056,0.85062176438971493,0.86297693964078759,0.87532249665391249,0.88765526454136945,0.89997051282660467,0.91226086393563033,0.92451415586536645,0.93670886075949367,0.94880309655603334,0.96070398859442241,0.97216245203380058,0.98229744042799594,0.98736943673952005],[0.020062885150771481,0.032465825109695867,0.044868747722837887,0.057271652305572851,0.069674538136767938,0.082077404456315506,0.094480250462465221,0.10688307530893171,0.11928587810175884,0.13168865789591633,0.14409141369159795,0.15649414443019671,0.16889684898991542,0.18129952618098244,0.19370217474042351,0.20610479332634324,0.21850738051166441,0.23090993477725907,0.24331245450440675,0.25571493796649514,0.26811738331988133,0.28051978859380466,0.29292215167923941,0.30532447031655419,0.31772674208182383,0.33012896437162231,0.34253113438609506,0.35493324911007729,0.36733530529199387,0.37973729942022572,0.39213922769658727,0.40454108600648642,0.41694286988527907,0.42934457448023711,0.44174619450744879,0.45414772420284288,0.46654915726638624,0.47895048679831154,0.49135170522602056,0.50375280422002955,0.51615377459699208,0.52855460620742178,0.54095528780522195,0.5533558068954878,0.56575614955624098,0.57815630022873465,0.59055624146966912,0.60295595365699661,0.61535541463884758,0.62775459931232525,0.64015347911526388,0.65255202140922319,0.6649501887255691,0.67734793783784153,0.68974521861186155,0.702141972568882,0.71453813107464192,0.72693361303557169,0.73932832193830089,0.75172214200327081,0.76411493312709955,0.77650652414428711,0.78889670371888954,0.8012852078337418,0.81367170229711538,0.82605575778923523,0.83843681345694421,0.85081412242486854,0.86318666781331344,0.87555302882579278,0.88791115854336811,0.90025799732312994,0.91258876049876503,0.92489552970336275,0.9371642052633895,0.949367088607595,0.96144166359647276,0.97321384927633792,0.98400158103997026,0.98989554939161595],[0.020085677039511474,0.032488909177396441,0.044892131557580317,0.057295343794915188,0.069698545483713348,0.082101736196359743,0.094504915481810947,0.10690808286396758,0.11931123783990949,0.13171437987798185,0.14411750841571136,0.15652062285754231,0.16892372257236576,0.18132680689082881,0.19372987510239159,0.20613292645211023,0.21853596013711352,0.23093897530273821,0.2433419710382847,0.25574494637234702,0.2681479002676701,0.28055083161547401,0.29295373922917967,0.30535662183746515,0.31775947807656235,0.33016230648169886,0.34256510547757102,0.35496787336771818,0.36737060832264745,0.37977330836653189,0.39217597136228333,0.40457859499475746,0.41698117675181612,0.42938371390292052,0.44178620347487141,0.4541886422242406,0.46659102660595864,0.47899335273741572,0.4913956163573111,0.50379781277833247,0.51619993683255805,0.52860198280824144,0.54100394437634969,0.55340581450486481,0.56580758535839881,0.57820924818010555,0.59061079315213205,0.60301220922992171,0.6154134839444636,0.62781460316502224,0.64021555081280779,0.65261630851333952,0.66501685517161579,0.67741716644933536,0.68981721411676622,0.70221696524274746,0.7146163811736197,0.72701541623401278,0.73941401605691737,0.75181211541349069,0.76420963535861952,0.77660647942666161,0.78900252848711017,0.80139763367532191,0.81379160650245308,0.82618420473858067,0.83857511180109578,0.85096390587530635,0.86335001226451902,0.87573262729695944,0.88811059181865148,0.90048217053173241,0.91284464402445087,0.92519349799234751,0.93752065633936377,0.94981013050272423,0.96202531645569622,0.97406104946854666,0.98546450230287652,0.99242166204371196],[0.020101957284607508,0.032505398134393348,0.044908834647201412,0.057312266651839971,0.069715693967987491,0.082119116405575454,0.094522533764121341,0.10692594583200532,0.11932935238568498,0.13173275318884559,0.14413614799147279,0.15653953652884667,0.1689429185204433,0.18134629366873889,0.19374966165790064,0.20615302215235753,0.21855637479523349,0.23095971920662905,0.24336305498173527,0.25576638168875687,0.26816969886662623,0.28057300602248003,0.29297630262886976,0.30537958812067501,0.31778286189167804,0.33018612329075914,0.3425893716176609,0.35499260611826422,0.36739582597930831,0.37979903032247553,0.39220221819775591,0.40460538857597839,0.41700854034039092,0.42941167227714105,0.44181478306449007,0.45421787126055269,0.46662093528932935,0.47902397342474234,0.49142698377233573,0.50382996424823134,0.51623291255484793,0.52863582615278648,0.54103870222815775,0.55344153765446591,0.56584432894795822,0.5782470722150983,0.59064976309049122,0.60305239666317167,0.61545496738862959,0.62785746898324768,0.64025989429690233,0.65266223515827715,0.66506448218581116,0.6774666245550387,0.68986864971011297,0.70227054300324321,0.71467228724011855,0.72707386210142144,0.73947524339915571,0.75187640211001483,0.76427730310371089,0.77667790344774401,0.78907815011436733,0.80147797682849842,0.81387729965616273,0.82627601070461154,0.83867396891892088,0.851070986284441,0.86346680651778596,0.87586107100163546,0.88825326207214361,0.9006426039168709,0.91302787889461767,0.92540706121243432,0.93777651441289644,0.95012899866156508,0.96244776485168138,0.97468354430379744,0.98660692463816901,0.99494777469580797],[0.020111725561498539,0.032515291643482547,0.044918856641188998,0.057322420511817573,0.069725983210285447,0.082129544689072964,0.094533104898056664,0.10693666378432864,0.11934022129199984,0.13174377736198806,0.14414733193178564,0.15655088493520863,0.16895443630212115,0.18135798595813712,0.19376153382429318,0.20616507981668997,0.21856862384610232,0.23097216581754754,0.2433757056298157,0.25577924317494882,0.26818277833767024,0.28058631099475362,0.29298984101432446,0.30539336825508934,0.31779689256547938,0.33020041378269804,0.34260393173166248,0.35500744622382241,0.36741095705583993,0.37981446400810948,0.39221796684309995,0.40462146530348564,0.41702495911004167,0.42942844795926305,0.44183193152066724,0.45423540943372898,0.46663888130438624,0.47904234670104873,0.49144580515002056,0.50384925613023812,0.51625269906719673,0.5286561333259201,0.54105955820278773,0.55346297291600266,0.56586637659442274,0.57826976826442333,0.59067314683436944,0.60307651107617888,0.61547985960331453,0.62788319084437849,0.64028650301124002,0.65268979406033756,0.66509306164537962,0.67749630305913211,0.68989951516123793,0.70230269428798919,0.71470583613857064,0.72710893563027634,0.73951198671237117,0.75191498212411567,0.76431791307639319,0.77672076882723295,0.78912353610754915,0.80152619833158589,0.81392873449162384,0.82633111757913857,0.83873331227751935,0.8511352715016216,0.86353693105071083,0.87593820105500741,0.88833895172387201,0.90073898841424915,0.91313800535230571,0.92553549314222061,0.93793053550081773,0.95032130195843556,0.96270353060621716,0.97506449933078243,0.98734177215189878,0.99747388734790399],[0.020114981675435017,0.032518589502328221,0.044922197329221536,0.05732580515611474,0.069729412983007943,0.082133020809901147,0.094536628636794351,0.10694023646368767,0.11934384429058087,0.13174745211747407,0.14415105994436728,0.15655466777126059,0.1689582755981538,0.181361883425047,0.1937654912519402,0.20616909907883341,0.21857270690572672,0.23097631473261993,0.24337992255951324,0.25578353038640633,0.26818713821329954,0.28059074604019285,0.29299435386708605,0.30539796169397915,0.31780156952087246,0.33020517734776578,0.34260878517465898,0.35501239300155218,0.3674160008284455,0.37981960865533859,0.3922232164822318,0.40462682430912511,0.41703043213601843,0.42943403996291152,0.44183764778980483,0.45424125561669804,0.46664486344359124,0.47904847127048444,0.49145207909737765,0.50385568692427096,0.51625929475116417,0.52866290257805737,0.54106651040495057,0.55347011823184378,0.56587372605873698,0.5782773338856303,0.5906809417125235,0.60308454953941681,0.61548815736631002,0.62789176519320322,0.64029537302009643,0.65269898084698974,0.66510258867388283,0.67750619650077604,0.68990980432766935,0.70231341215456256,0.71471701998145587,0.72712062780834907,0.73952423563524228,0.75192784346213548,0.76433145128902868,0.776735059115922,0.78913866694281509,0.80154227476970852,0.81394588259660161,0.82634949042349481,0.83875309825038813,0.85115670607728133,0.86356031390417454,0.87596392173106774,0.88836752955796106,0.90077113738485426,0.91317474521174735,0.92557835303864067,0.93798196086553387,0.95038556869242719,0.96278917651932039,0.97519278434621348,0.9875963921731068,1]],"text":[["","","","","","","","","","","","","","","","","","","","","","","","","","","","","","","","","","","","","","","","","","","","","","","","","","","","","","","","","","","","","","","","","","","","","","","","","","","","","","","",""],["","","","","","","","","","","","","","","","","","","","","","","","","","","","","","","","","","","","","","","","","","","","","","","","","","","","","","","","","","","","","","","","","","","","","","","","","","","","","","","",""],["","","","","","","","","","","","","","","","","","","","","","","","","","","","","","","","","","","","","","","","","","","","","","","","","","","","","","","","","","","","","","","","","","","","","","","","","","","","","","","",""],["","","","","","","","","","","","","","","","","","","","","","","","","","","","","","","","","","","","","","","","","","","","","","","","","","","","","","","","","","","","","","","","","","","","","","","","","","","","","","","",""],["","","","","","","","","","","","","","","","","","","","","","","","","","","","","","","","","","","","","","","","","","","","","","","","","","","","","","","","","","","","","","","","","","","","","","","","","","","","","","","",""],["","","","","","","","","","","","","","","","","","","","","","","","","","","","","","","","","","","","","","","","","","","","","","","","","","","","","","","","","","","","","","","","","","","","","","","","","","","","","","","",""],["","","","","","","","","","","","","","","","","","","","","","","","","","","","","","","","","","","","","","","","","","","","","","","","","","","","","","","","","","","","","","","","","","","","","","","","","","","","","","","",""],["","","","","","","","","","","","","","","","","","","","","","","","","","","","","","","","","","","","","","","","","","","","","","","","","","","","","","","","","","","","","","","","","","","","","","","","","","","","","","","",""],["","","","","","","","","","","","","","","","","","","","","","","","","","","","","","","","","","","","","","","","","","","","","","","","","","","","","","","","","","","","","","","","","","","","","","","","","","","","","","","",""],["","","","","","","","","","","","","","","","","","","","","","","","","","","","","","","","","","","","","","","","","","","","","","","","","","","","","","","","","","","","","","","","","","","","","","","","","","","","","","","",""],["","","","","","","","","","","","","","","","","","","","","","","","","","","","","","","","","","","","","","","","","","","","","","","","","","","","","","","","","","","","","","","","","","","","","","","","","","","","","","","",""],["","","","","","","","","","","","","","","","","","","","","","","","","","","","","","","","","","","","","","","","","","","","","","","","","","","","","","","","","","","","","","","","","","","","","","","","","","","","","","","",""],["","","","","","","","","","","","","","","","","","","","","","","","","","","","","","","","","","","","","","","","","","","","","","","","","","","","","","","","","","","","","","","","","","","","","","","","","","","","","","","",""],["","","","","","","","","","","","","","","","","","","","","","","","","","","","","","","","","","","","","","","","","","","","","","","","","","","","","","","","","","","","","","","","","","","","","","","","","","","","","","","",""],["","","","","","","","","","","","","","","","","","","","","","","","","","","","","","","","","","","","","","","","","","","","","","","","","","","","","","","","","","","","","","","","","","","","","","","","","","","","","","","",""],["","","","","","","","","","","","","","","","","","","","","","","","","","","","","","","","","","","","","","","","","","","","","","","","","","","","","","","","","","","","","","","","","","","","","","","","","","","","","","","",""],["","","","","","","","","","","","","","","","","","","","","","","","","","","","","","","","","","","","","","","","","","","","","","","","","","","","","","","","","","","","","","","","","","","","","","","","","","","","","","","",""],["","","","","","","","","","","","","","","","","","","","","","","","","","","","","","","","","","","","","","","","","","","","","","","","","","","","","","","","","","","","","","","","","","","","","","","","","","","","","","","",""],["","","","","","","","","","","","","","","","","","","","","","","","","","","","","","","","","","","","","","","","","","","","","","","","","","","","","","","","","","","","","","","","","","","","","","","","","","","","","","","",""],["","","","","","","","","","","","","","","","","","","","","","","","","","","","","","","","","","","","","","","","","","","","","","","","","","","","","","","","","","","","","","","","","","","","","","","","","","","","","","","",""],["","","","","","","","","","","","","","","","","","","","","","","","","","","","","","","","","","","","","","","","","","","","","","","","","","","","","","","","","","","","","","","","","","","","","","","","","","","","","","","",""],["","","","","","","","","","","","","","","","","","","","","","","","","","","","","","","","","","","","","","","","","","","","","","","","","","","","","","","","","","","","","","","","","","","","","","","","","","","","","","","",""],["","","","","","","","","","","","","","","","","","","","","","","","","","","","","","","","","","","","","","","","","","","","","","","","","","","","","","","","","","","","","","","","","","","","","","","","","","","","","","","",""],["","","","","","","","","","","","","","","","","","","","","","","","","","","","","","","","","","","","","","","","","","","","","","","","","","","","","","","","","","","","","","","","","","","","","","","","","","","","","","","",""],["","","","","","","","","","","","","","","","","","","","","","","","","","","","","","","","","","","","","","","","","","","","","","","","","","","","","","","","","","","","","","","","","","","","","","","","","","","","","","","",""],["","","","","","","","","","","","","","","","","","","","","","","","","","","","","","","","","","","","","","","","","","","","","","","","","","","","","","","","","","","","","","","","","","","","","","","","","","","","","","","",""],["","","","","","","","","","","","","","","","","","","","","","","","","","","","","","","","","","","","","","","","","","","","","","","","","","","","","","","","","","","","","","","","","","","","","","","","","","","","","","","",""],["","","","","","","","","","","","","","","","","","","","","","","","","","","","","","","","","","","","","","","","","","","","","","","","","","","","","","","","","","","","","","","","","","","","","","","","","","","","","","","",""],["","","","","","","","","","","","","","","","","","","","","","","","","","","","","","","","","","","","","","","","","","","","","","","","","","","","","","","","","","","","","","","","","","","","","","","","","","","","","","","",""],["","","","","","","","","","","","","","","","","","","","","","","","","","","","","","","","","","","","","","","","","","","","","","","","","","","","","","","","","","","","","","","","","","","","","","","","","","","","","","","",""],["","","","","","","","","","","","","","","","","","","","","","","","","","","","","","","","","","","","","","","","","","","","","","","","","","","","","","","","","","","","","","","","","","","","","","","","","","","","","","","",""],["","","","","","","","","","","","","","","","","","","","","","","","","","","","","","","","","","","","","","","","","","","","","","","","","","","","","","","","","","","","","","","","","","","","","","","","","","","","","","","",""],["","","","","","","","","","","","","","","","","","","","","","","","","","","","","","","","","","","","","","","","","","","","","","","","","","","","","","","","","","","","","","","","","","","","","","","","","","","","","","","",""],["","","","","","","","","","","","","","","","","","","","","","","","","","","","","","","","","","","","","","","","","","","","","","","","","","","","","","","","","","","","","","","","","","","","","","","","","","","","","","","",""],["","","","","","","","","","","","","","","","","","","","","","","","","","","","","","","","","","","","","","","","","","","","","","","","","","","","","","","","","","","","","","","","","","","","","","","","","","","","","","","",""],["","","","","","","","","","","","","","","","","","","","","","","","","","","","","","","","","","","","","","","","","","","","","","","","","","","","","","","","","","","","","","","","","","","","","","","","","","","","","","","",""],["","","","","","","","","","","","","","","","","","","","","","","","","","","","","","","","","","","","","","","","","","","","","","","","","","","","","","","","","","","","","","","","","","","","","","","","","","","","","","","",""],["","","","","","","","","","","","","","","","","","","","","","","","","","","","","","","","","","","","","","","","","","","","","","","","","","","","","","","","","","","","","","","","","","","","","","","","","","","","","","","",""],["","","","","","","","","","","","","","","","","","","","","","","","","","","","","","","","","","","","","","","","","","","","","","","","","","","","","","","","","","","","","","","","","","","","","","","","","","","","","","","",""],["","","","","","","","","","","","","","","","","","","","","","","","","","","","","","","","","","","","","","","","","","","","","","","","","","","","","","","","","","","","","","","","","","","","","","","","","","","","","","","",""],["","","","","","","","","","","","","","","","","","","","","","","","","","","","","","","","","","","","","","","","","","","","","","","","","","","","","","","","","","","","","","","","","","","","","","","","","","","","","","","",""],["","","","","","","","","","","","","","","","","","","","","","","","","","","","","","","","","","","","","","","","","","","","","","","","","","","","","","","","","","","","","","","","","","","","","","","","","","","","","","","",""],["","","","","","","","","","","","","","","","","","","","","","","","","","","","","","","","","","","","","","","","","","","","","","","","","","","","","","","","","","","","","","","","","","","","","","","","","","","","","","","",""],["","","","","","","","","","","","","","","","","","","","","","","","","","","","","","","","","","","","","","","","","","","","","","","","","","","","","","","","","","","","","","","","","","","","","","","","","","","","","","","",""],["","","","","","","","","","","","","","","","","","","","","","","","","","","","","","","","","","","","","","","","","","","","","","","","","","","","","","","","","","","","","","","","","","","","","","","","","","","","","","","",""],["","","","","","","","","","","","","","","","","","","","","","","","","","","","","","","","","","","","","","","","","","","","","","","","","","","","","","","","","","","","","","","","","","","","","","","","","","","","","","","",""],["","","","","","","","","","","","","","","","","","","","","","","","","","","","","","","","","","","","","","","","","","","","","","","","","","","","","","","","","","","","","","","","","","","","","","","","","","","","","","","",""],["","","","","","","","","","","","","","","","","","","","","","","","","","","","","","","","","","","","","","","","","","","","","","","","","","","","","","","","","","","","","","","","","","","","","","","","","","","","","","","",""],["","","","","","","","","","","","","","","","","","","","","","","","","","","","","","","","","","","","","","","","","","","","","","","","","","","","","","","","","","","","","","","","","","","","","","","","","","","","","","","",""],["","","","","","","","","","","","","","","","","","","","","","","","","","","","","","","","","","","","","","","","","","","","","","","","","","","","","","","","","","","","","","","","","","","","","","","","","","","","","","","",""],["","","","","","","","","","","","","","","","","","","","","","","","","","","","","","","","","","","","","","","","","","","","","","","","","","","","","","","","","","","","","","","","","","","","","","","","","","","","","","","",""],["","","","","","","","","","","","","","","","","","","","","","","","","","","","","","","","","","","","","","","","","","","","","","","","","","","","","","","","","","","","","","","","","","","","","","","","","","","","","","","",""],["","","","","","","","","","","","","","","","","","","","","","","","","","","","","","","","","","","","","","","","","","","","","","","","","","","","","","","","","","","","","","","","","","","","","","","","","","","","","","","",""],["","","","","","","","","","","","","","","","","","","","","","","","","","","","","","","","","","","","","","","","","","","","","","","","","","","","","","","","","","","","","","","","","","","","","","","","","","","","","","","",""],["","","","","","","","","","","","","","","","","","","","","","","","","","","","","","","","","","","","","","","","","","","","","","","","","","","","","","","","","","","","","","","","","","","","","","","","","","","","","","","",""],["","","","","","","","","","","","","","","","","","","","","","","","","","","","","","","","","","","","","","","","","","","","","","","","","","","","","","","","","","","","","","","","","","","","","","","","","","","","","","","",""],["","","","","","","","","","","","","","","","","","","","","","","","","","","","","","","","","","","","","","","","","","","","","","","","","","","","","","","","","","","","","","","","","","","","","","","","","","","","","","","",""],["","","","","","","","","","","","","","","","","","","","","","","","","","","","","","","","","","","","","","","","","","","","","","","","","","","","","","","","","","","","","","","","","","","","","","","","","","","","","","","",""],["","","","","","","","","","","","","","","","","","","","","","","","","","","","","","","","","","","","","","","","","","","","","","","","","","","","","","","","","","","","","","","","","","","","","","","","","","","","","","","",""],["","","","","","","","","","","","","","","","","","","","","","","","","","","","","","","","","","","","","","","","","","","","","","","","","","","","","","","","","","","","","","","","","","","","","","","","","","","","","","","",""],["","","","","","","","","","","","","","","","","","","","","","","","","","","","","","","","","","","","","","","","","","","","","","","","","","","","","","","","","","","","","","","","","","","","","","","","","","","","","","","",""],["","","","","","","","","","","","","","","","","","","","","","","","","","","","","","","","","","","","","","","","","","","","","","","","","","","","","","","","","","","","","","","","","","","","","","","","","","","","","","","",""],["","","","","","","","","","","","","","","","","","","","","","","","","","","","","","","","","","","","","","","","","","","","","","","","","","","","","","","","","","","","","","","","","","","","","","","","","","","","","","","",""],["","","","","","","","","","","","","","","","","","","","","","","","","","","","","","","","","","","","","","","","","","","","","","","","","","","","","","","","","","","","","","","","","","","","","","","","","","","","","","","",""],["","","","","","","","","","","","","","","","","","","","","","","","","","","","","","","","","","","","","","","","","","","","","","","","","","","","","","","","","","","","","","","","","","","","","","","","","","","","","","","",""],["","","","","","","","","","","","","","","","","","","","","","","","","","","","","","","","","","","","","","","","","","","","","","","","","","","","","","","","","","","","","","","","","","","","","","","","","","","","","","","",""],["","","","","","","","","","","","","","","","","","","","","","","","","","","","","","","","","","","","","","","","","","","","","","","","","","","","","","","","","","","","","","","","","","","","","","","","","","","","","","","",""],["","","","","","","","","","","","","","","","","","","","","","","","","","","","","","","","","","","","","","","","","","","","","","","","","","","","","","","","","","","","","","","","","","","","","","","","","","","","","","","",""],["","","","","","","","","","","","","","","","","","","","","","","","","","","","","","","","","","","","","","","","","","","","","","","","","","","","","","","","","","","","","","","","","","","","","","","","","","","","","","","",""],["","","","","","","","","","","","","","","","","","","","","","","","","","","","","","","","","","","","","","","","","","","","","","","","","","","","","","","","","","","","","","","","","","","","","","","","","","","","","","","",""],["","","","","","","","","","","","","","","","","","","","","","","","","","","","","","","","","","","","","","","","","","","","","","","","","","","","","","","","","","","","","","","","","","","","","","","","","","","","","","","",""],["","","","","","","","","","","","","","","","","","","","","","","","","","","","","","","","","","","","","","","","","","","","","","","","","","","","","","","","","","","","","","","","","","","","","","","","","","","","","","","",""],["","","","","","","","","","","","","","","","","","","","","","","","","","","","","","","","","","","","","","","","","","","","","","","","","","","","","","","","","","","","","","","","","","","","","","","","","","","","","","","",""],["","","","","","","","","","","","","","","","","","","","","","","","","","","","","","","","","","","","","","","","","","","","","","","","","","","","","","","","","","","","","","","","","","","","","","","","","","","","","","","",""],["","","","","","","","","","","","","","","","","","","","","","","","","","","","","","","","","","","","","","","","","","","","","","","","","","","","","","","","","","","","","","","","","","","","","","","","","","","","","","","",""],["","","","","","","","","","","","","","","","","","","","","","","","","","","","","","","","","","","","","","","","","","","","","","","","","","","","","","","","","","","","","","","","","","","","","","","","","","","","","","","",""],["","","","","","","","","","","","","","","","","","","","","","","","","","","","","","","","","","","","","","","","","","","","","","","","","","","","","","","","","","","","","","","","","","","","","","","","","","","","","","","",""],["","","","","","","","","","","","","","","","","","","","","","","","","","","","","","","","","","","","","","","","","","","","","","","","","","","","","","","","","","","","","","","","","","","","","","","","","","","","","","","",""],["","","","","","","","","","","","","","","","","","","","","","","","","","","","","","","","","","","","","","","","","","","","","","","","","","","","","","","","","","","","","","","","","","","","","","","","","","","","","","","",""],["","","","","","","","","","","","","","","","","","","","","","","","","","","","","","","","","","","","","","","","","","","","","","","","","","","","","","","","","","","","","","","","","","","","","","","","","","","","","","","",""]],"colorscale":[[0,"#FDFAF5"],[0.00050105326997940125,"#FDFAF5"],[0.00099597021878672365,"#FDFAF5"],[0.0014847417219664427,"#FDFAF5"],[0.0019673587505992796,"#FDFAF4"],[0.0024438123720929017,"#FDF9F4"],[0.0029140937509670728,"#FDF9F4"],[0.003378194149631808,"#FDF9F4"],[0.0038361049291615323,"#FDF9F4"],[0.0042878175500602467,"#FDF9F4"],[0.0047333235730223633,"#FCF9F4"],[0.0051726146596866585,"#FCF9F4"],[0.0056056825733824533,"#FCF9F3"],[0.0060325191798702438,"#FCF8F3"],[0.0064531164480743364,"#FCF8F3"],[0.0068674664508092675,"#FCF8F3"],[0.0072755613654978957,"#FCF8F3"],[0.0076773934748829431,"#FCF8F3"],[0.0080729551677302114,"#FCF8F3"],[0.0084622389395252462,"#FCF8F3"],[0.0088452373931604544,"#FCF8F3"],[0.0092219432396152268,"#FCF8F2"],[0.0095923492986283998,"#FCF8F2"],[0.0099564484993611702,"#FCF7F2"],[0.010314233881052459,"#FCF7F2"],[0.010665698593665174,"#FCF7F2"],[0.011010835898524474,"#FCF7F2"],[0.011349639168946712,"#FCF7F2"],[0.011682101890858831,"#FCF7F2"],[0.012008217663410092,"#FCF7F2"],[0.012151008239806194,"#FCF7F2"],[0.012327980199573152,"#FCF7F2"],[0.01264138332673681,"#FCF7F1"],[0.012658227848101222,"#FCF7F1"],[0.012948420987288212,"#FCF7F1"],[0.013159241802034871,"#FBF7F1"],[0.013249087239187274,"#FBF7F1"],[0.013543376256528461,"#FBF7F1"],[0.01365404064512965,"#FBF7F1"],[0.013831282330095895,"#FBF7F1"],[0.014112799867906367,"#FBF6F1"],[0.014142615019349547,"#FBF6F1"],[0.014387923395742352,"#FBF6F1"],[0.014624955665937467,"#FBF6F1"],[0.01465664755767615,"#FBF6F1"],[0.014918967116582804,"#FBF6F1"],[0.01510105342624779,"#FBF6F1"],[0.015174876954641814,"#FBF6F1"],[0.015424372073830073,"#FBF6F1"],[0.015570899242570935,"#FBF6F1"],[0.015667447596402595,"#FBF6F1"],[0.01590409876536325,"#FBF6F1"],[0.01603448415895381,"#FBF6F1"],[0.016134320944924285,"#FBF6F1"],[0.016358109620955186,"#FBF6F0"],[0.016491799322011946,"#FBF6F0"],[0.016575460401420217,"#FBF6F0"],[0.01678636901680497,"#FBF6F0"],[0.016942835981735072,"#FBF6F0"],[0.016990831320531252,"#FBF6F0"],[0.017188843289360767,"#FBF6F0"],[0.017380401023788461,"#FBF6F0"],[0.017387585492287916,"#FBF6F0"],[0.017565500748421781,"#FBF6F0"],[0.01774413881235104,"#FBF6F0"],[0.01782603931280069,"#FBF5F0"],[0.017916311689506359,"#FBF5F0"],[0.018082015979003718,"#FBF5F0"],[0.018241248405477695,"#FBF5F0"],[0.018258189008155568,"#FBF5F0"],[0.01839400581940509,"#FBF5F0"],[0.01854028519741302,"#FBF5F0"],[0.018680083642577339,"#FBF5F0"],[0.018684026249763397,"#FBF5F0"],[0.018813398384708635,"#FBF5F0"],[0.018940226780624458,"#FBF5F0"],[0.019060566314411775,"#FBF5F0"],[0.019103542816334862,"#FBF5F0"],[0.019174414597674327,"#FBF5F0"],[0.019281769369769886,"#FBF5F0"],[0.019382628498033516,"#FBF5F0"],[0.01947698997798919,"#FBF5F0"],[0.01951673059464254,"#FBF5F0"],[0.019564851933548177,"#FBF5F0"],[0.019646212617195902,"#FBF5F0"],[0.019721070410164576,"#FBF5F0"],[0.019789423822594632,"#FBF5F0"],[0.019851271493682709,"#FBF5F0"],[0.019906612191816664,"#FBF5EF"],[0.019923581580276073,"#FBF5EF"],[0.019955444814698353,"#FBF5EF"],[0.019997768389453219,"#FBF5EF"],[0.020033582072727429,"#FBF5EF"],[0.020062885150771481,"#FBF5EF"],[0.020085677039511474,"#FBF5EF"],[0.020101957284607508,"#FBF5EF"],[0.020111725561498539,"#FBF5EF"],[0.020114981675435017,"#FBF5EF"],[0.020324087878388686,"#FBF5EF"],[0.02071824170443648,"#FBF5EF"],[0.021106035384908406,"#FBF5EF"],[0.02148746135804902,"#FBF5EF"],[0.021862512174570803,"#FAF4EF"],[0.022231180498360481,"#FAF4EF"],[0.022593459107173919,"#FAF4EF"],[0.0229493408933229,"#FAF4EF"],[0.023298818864353588,"#FAF4EF"],[0.023641886143714541,"#FAF4EE"],[0.023978535971415083,"#FAF4EE"],[0.024295659527175495,"#FAF4EE"],[0.024308761704675774,"#FAF4EE"],[0.024632556818566798,"#FAF4EE"],[0.024809195832974473,"#FAF4EE"],[0.024949914906638559,"#FAF4EE"],[0.025260829681540309,"#FAF4EE"],[0.025316455696202556,"#FAF4EE"],[0.025565294975631314,"#FAF4EE"],[0.025817429312370854,"#FAF3EE"],[0.02586330474157772,"#FAF3EE"],[0.026154853052943405,"#FAF3EE"],[0.02631210697844022,"#FAF3EE"],[0.026439934104767082,"#FAF3EE"],[0.026718542214129948,"#FAF3EE"],[0.026800479093709306,"#FAF3EE"],[0.026990671820712131,"#FAF3EE"],[0.027256317487339476,"#FAF3ED"],[0.027282536160697313,"#FAF3ED"],[0.027515473900516896,"#FAF3ED"],[0.027758268786019169,"#FAF3ED"],[0.027768135870952282,"#FAF3ED"],[0.028014298334068988,"#FAF3ED"],[0.02822766768125462,"#FAF3ED"],[0.028253956350506537,"#FAF3ED"],[0.028487105106609123,"#FAF3ED"],[0.028690723663810647,"#FAF3ED"],[0.028713739914904224,"#FAF3ED"],[0.028933856214567677,"#FAF3ED"],[0.029147427657776781,"#FAF3ED"],[0.029147449571877648,"#FAF3ED"],[0.029354515680657056,"#FAF3ED"],[0.029555050362702895,"#FAF3ED"],[0.029597770694773207,"#FAF3ED"],[0.029749049568204566,"#FAF2ED"],[0.029936509376148779,"#FAF2ED"],[0.030041743914791863,"#FAF2ED"],[0.030117425994712788,"#FAF2ED"],[0.030291795761645535,"#FAF2ED"],[0.030459615144635133,"#F9F2ED"],[0.030479338567029446,"#F9F2ED"],[0.030620880741664469,"#F9F2ED"],[0.030775589281354598,"#F9F2EC"],[0.030910546010713635,"#F9F2EC"],[0.030923737623293701,"#F9F2EC"],[0.031065322758355163,"#F9F2EC"],[0.03120034180900122,"#F9F2EC"],[0.03132879202957406,"#F9F2EC"],[0.031335357715920442,"#F9F2EC"],[0.031450670806574599,"#F9F2EC"],[0.031565975658926715,"#F9F2EC"],[0.031674704238229268,"#F9F2EC"],[0.031753765264384337,"#F9F2EC"],[0.031776854328994353,"#F9F2EC"],[0.031872423848873122,"#F9F2EC"],[0.031961410848866501,"#F9F2EC"],[0.032043813513524921,"#F9F2EC"],[0.032119630161131396,"#F9F2EC"],[0.032165760350300499,"#F9F2EC"],[0.032188859243874712,"#F9F2EC"],[0.032251499348006196,"#F9F2EC"],[0.032307549193984042,"#F9F2EC"],[0.032357007636603985,"#F9F2EC"],[0.032399873665116097,"#F9F2EC"],[0.03243614640332837,"#F9F2EC"],[0.032465825109695867,"#F9F2EC"],[0.032488909177396441,"#F9F2EC"],[0.032505398134393348,"#F9F2EC"],[0.032515291643482547,"#F9F2EC"],[0.032518589502328221,"#F9F2EC"],[0.032571334781117178,"#F9F2EC"],[0.032970480478321296,"#F9F2EC"],[0.033363189478214483,"#F9F2EC"],[0.033749453932680029,"#F9F1EC"],[0.034129266109941714,"#F9F1EC"],[0.034502618395312323,"#F9F1EB"],[0.034869503291934056,"#F9F1EB"],[0.035229913421508274,"#F9F1EB"],[0.035583841525016369,"#F9F1EB"],[0.035931280463430193,"#F9F1EB"],[0.036272223218413058,"#F9F1EB"],[0.036433713495727327,"#F9F1EB"],[0.036606662893010622,"#F9F1EB"],[0.036934592712330683,"#F9F1EB"],[0.036953722294689073,"#F9F1EB"],[0.037256006024213306,"#F9F1EB"],[0.037467382367362245,"#F9F1EB"],[0.037570896299889966,"#F9F1EB"],[0.037879257134632471,"#F9F0EB"],[0.037974683544303778,"#F9F0EB"],[0.038181082248390008,"#F9F0EA"],[0.038475615760635296,"#F9F0EA"],[0.038476365486415864,"#F9F0EA"],[0.038765100819883602,"#F9F0EA"],[0.038970169056985804,"#F8F0EA"],[0.039047282346489909,"#F8F0EA"],[0.0393229042910479,"#F8F0EA"],[0.039458333580427274,"#F8F0EA"],[0.03959196100606821,"#F8F0EA"],[0.039854446972327873,"#F8F0EA"],[0.039940099585404454,"#F8F0EA"],[0.040110356799427982,"#F8F0EA"],[0.040359685226339481,"#F8F0EA"],[0.040415457434656799,"#F8F0EA"],[0.040602427121935292,"#F8F0EA"],[0.040838577485512673,"#F8F0EA"],[0.040884397600134625,"#F8F0EA"],[0.041068131447301148,"#F8F0EA"],[0.041291084268959111,"#F8F0EA"],[0.041346910663906167,"#F8F0EA"],[0.041507431344056767,"#F8F0EA"],[0.041717168198548094,"#F8EFE9"],[0.041802987319059404,"#F8EFE9"],[0.041920290491227363,"#F8EFE9"],[0.042116794014176118,"#F8EFE9"],[0.042252618370594019,"#F8EFE9"],[0.042306674693193491,"#F8EFE9"],[0.042489928588216097,"#F8EFE9"],[0.042666551893723703,"#F8EFE9"],[0.042695794736307691,"#F8EFE9"],[0.042836540939131251,"#F8EFE9"],[0.042999892189167777,"#F8EFE9"],[0.043132507447672719,"#F8EFE9"],[0.043156602244242004,"#F8EFE9"],[0.043306667840793955,"#F8EFE9"],[0.043450085851632791,"#F8EFE9"],[0.043562747650705003,"#F8EFE9"],[0.043586853286261884,"#F8EFE9"],[0.043716967291188236,"#F8EFE9"],[0.043840425150219908,"#F8EFE9"],[0.043957224284747576,"#F8EFE9"],[0.043986506606825237,"#F8EFE9"],[0.044067362254013864,"#F8EFE9"],[0.044170836755366927,"#F8EFE9"],[0.04426764562450114,"#F8EFE9"],[0.044357786835682367,"#F8EFE9"],[0.044403775693710235,"#F8EFE9"],[0.044441258501960013,"#F8EFE9"],[0.044518058875363531,"#F8EFE9"],[0.044588186347086056,"#F8EFE9"],[0.044651639447651603,"#F8EFE9"],[0.044708416847069832,"#F8EFE9"],[0.044758517354975158,"#F8EFE9"],[0.044801939920750544,"#F8EFE9"],[0.044814546406136913,"#F8EFE9"],[0.044838683633638965,"#F8EFE9"],[0.044868747722837887,"#F8EFE9"],[0.044892131557580317,"#F8EFE9"],[0.044908834647201412,"#F8EFE9"],[0.044918856641188998,"#F8EFE9"],[0.044922197329221536,"#F8EFE9"],[0.045218810356816186,"#F8EFE9"],[0.045616559277218527,"#F8EFE8"],[0.046007785018389868,"#F8EEE8"],[0.046392479551757959,"#F8EEE8"],[0.046770634969928948,"#F8EEE8"],[0.047142243487474866,"#F8EEE8"],[0.047507297441710006,"#F7EEE8"],[0.047865789293457972,"#F7EEE8"],[0.048217711627808191,"#F7EEE8"],[0.048563057154860534,"#F7EEE8"],[0.048564917647028416,"#F7EEE8"],[0.048901818710462397,"#F7EEE7"],[0.049091560429487924,"#F7EEE7"],[0.049233989256931232,"#F7EEE7"],[0.049559561883768311,"#F7EEE7"],[0.049611780664812088,"#F7EDE7"],[0.049878529808360716,"#F7EDE7"],[0.050125567800641369,"#F7EDE7"],[0.050190886376672239,"#F7EDE7"],[0.050496625063921385,"#F7EDE7"],[0.050632911392405,"#F7EDE7"],[0.050795739475250068,"#F7EDE7"],[0.051088223346378081,"#F7EDE7"],[0.051133801104323195,"#F7EDE7"],[0.051374070544246808,"#F7EDE7"],[0.051628226710399461,"#F7EDE7"],[0.051653275067651161,"#F7EDE7"],[0.051925831047858084,"#F7EDE7"],[0.052116178095408805,"#F7EDE7"],[0.052191732749213071,"#F7EDE7"],[0.052450974569734465,"#F7EDE7"],[0.05259764525587618,"#F7EDE6"],[0.052703551041694663,"#F7EDE6"],[0.052949456832188768,"#F7EDE6"],[0.053072618301050367,"#F7EDE6"],[0.053188686743689373,"#F7EDE6"],[0.053421235714589232,"#F7EDE6"],[0.053541087453867209,"#F7EDE6"],[0.05364709881973051,"#F7ECE6"],[0.053866271270919808,"#F7ECE6"],[0.054003043051907951,"#F7ECE6"],[0.054078748417430544,"#F7ECE6"],[0.05428452574649123,"#F7ECE6"],[0.054458475548347707,"#F7ECE6"],[0.054483598883760642,"#F7ECE6"],[0.054675963593787791,"#F7ECE6"],[0.054861615780459227,"#F7ECE6"],[0.054907375512896706,"#F7ECE6"],[0.05504055148743181,"#F7ECE6"],[0.055212766898550814,"#F7ECE6"],[0.055349733632732323,"#F7ECE6"],[0.055378258338254605,"#F7ECE6"],[0.055537022271964109,"#F7ECE6"],[0.055689055306457957,"#F7ECE6"],[0.055785540713424342,"#F7ECE6"],[0.055834354190233415,"#F7ECE6"],[0.055972915813852775,"#F6ECE6"],[0.056104737210273425,"#F6ECE6"],[0.056214787679848555,"#F6ECE5"],[0.056229815555165374,"#F6ECE5"],[0.056348148167212342,"#F6ECE5"],[0.056459732508398086,"#F6ECE5"],[0.056564566184277631,"#F6ECE5"],[0.056637465577094148,"#F6ECE5"],[0.056662646944233952,"#F6ECE5"],[0.056753972681718667,"#F6ECE5"],[0.056838541434477974,"#F6ECE5"],[0.05691635138476292,"#F6ECE5"],[0.056987400859524362,"#F6ECE5"],[0.057051688330593153,"#F6ECE5"],[0.057053565571359877,"#F6ECE5"],[0.057109212414843569,"#F6ECE5"],[0.057159971874342741,"#F6ECE5"],[0.057203965616482777,"#F6ECE5"],[0.057241192694099441,"#F6ECE5"],[0.057271652305572851,"#F6ECE5"],[0.057295343794915188,"#F6ECE5"],[0.057312266651839971,"#F6ECE5"],[0.057322420511817573,"#F6ECE5"],[0.05732580515611474,"#F6ECE5"],[0.057463078950842905,"#F6ECE5"],[0.057865997126615443,"#F6EBE5"],[0.058262311633494046,"#F6EBE5"],[0.058652014130897379,"#F6EBE5"],[0.059035096403694753,"#F6EBE5"],[0.05941155036304302,"#F6EBE5"],[0.059781368047215011,"#F6EBE5"],[0.060144541622414671,"#F6EBE4"],[0.060501063383583187,"#F6EBE4"],[0.060689006584813687,"#F6EBE4"],[0.060850925755193797,"#F6EBE4"],[0.061194121292033277,"#F6EBE4"],[0.061222450809008344,"#F6EBE4"],[0.061530642679974989,"#F6EBE4"],[0.061749397085337554,"#F6EAE4"],[0.061860482736738165,"#F6EAE4"],[0.062183634412635302,"#F6EAE4"],[0.062269834459468654,"#F6EAE4"],[0.062500090791309471,"#F6EAE4"],[0.06278375208819631,"#F6EAE4"],[0.062809845090456173,"#F6EAE4"],[0.063112890662536225,"#F6EAE4"],[0.063291139240506333,"#F6EAE4"],[0.06340922099547408,"#F6EAE4"],[0.063698829713343175,"#F6EAE3"],[0.063791985298630394,"#F6EAE3"],[0.063981710577040274,"#F6EAE3"],[0.064257857484944725,"#F6EAE3"],[0.064286279759095732,"#F6EAE3"],[0.064527264473565382,"#F5EAE3"],[0.064774012233765554,"#F5EAE3"],[0.064789925718174435,"#F5EAE3"],[0.065045835533427465,"#F5EAE3"],[0.065255172450873311,"#F5EAE3"],[0.065294988373969409,"#F5EAE3"],[0.065537378835027305,"#F5EAE3"],[0.065729750256047881,"#F5E9E3"],[0.065773001652988605,"#F5E9E3"],[0.066001851705965842,"#F5E9E3"],[0.066197735613331976,"#F5E9E3"],[0.066223924014346736,"#F5E9E3"],[0.066439213741329994,"#F5E9E3"],[0.066647716193445783,"#F5E9E3"],[0.066659118606190559,"#F5E9E3"],[0.066849426821063984,"#F5E9E3"],[0.067044341218884473,"#F5E9E3"],[0.067113889438512708,"#F5E9E3"],[0.067232455126414736,"#F5E9E2"],[0.067413764428431722,"#F5E9E2"],[0.067562038435602934,"#F5E9E2"],[0.067588265155428484,"#F5E9E2"],[0.067755953484045728,"#F5E9E2"],[0.06791682573748814,"#F5E9E2"],[0.068003556045164504,"#F5E9E2"],[0.068070878385925071,"#F5E9E2"],[0.068218108046875114,"#F5E9E2"],[0.068358511485576479,"#F5E9E2"],[0.068438432838273555,"#F5E9E2"],[0.068492085615340259,"#F5E9E2"],[0.068618827497888168,"#F5E9E2"],[0.068738734343674723,"#F5E9E2"],[0.068851803512193221,"#F5E9E2"],[0.068866659510343431,"#F5E9E2"],[0.06895803251226551,"#F5E9E2"],[0.069057419002315434,"#F5E9E2"],[0.069149960790626963,"#F5E9E2"],[0.069235655835584664,"#F5E9E2"],[0.069288226882079251,"#F5E9E2"],[0.069314502245898524,"#F5E9E2"],[0.069386498280813225,"#F5E9E2"],[0.069451642350298659,"#F5E9E2"],[0.069509933015226566,"#F5E9E2"],[0.069561368987528627,"#F5E9E2"],[0.069605949130338796,"#F5E8E2"],[0.069643672458118977,"#F5E8E2"],[0.069674538136767938,"#F5E8E2"],[0.069698545483713348,"#F5E8E2"],[0.06970312590042349,"#F5E8E2"],[0.069715693967987491,"#F5E8E2"],[0.069725983210285447,"#F5E8E2"],[0.069729412983007943,"#F5E8E2"],[0.07011134763949034,"#F5E8E2"],[0.070512883301490525,"#F5E8E2"],[0.070907724217645463,"#F5E8E1"],[0.071295861849091091,"#F5E8E1"],[0.071677287787769051,"#F5E8E1"],[0.072051993757309085,"#F5E8E1"],[0.072419971613899237,"#F5E8E1"],[0.072781213347143048,"#F5E8E1"],[0.072805701191228422,"#F4E8E1"],[0.07313571108090744,"#F4E8E1"],[0.073346120572567841,"#F4E8E1"],[0.0734834570741566,"#F4E8E1"],[0.073824443721775213,"#F4E7E1"],[0.07387996498154048,"#F4E7E1"],[0.074158663555377591,"#F4E7E1"],[0.074407223041613513,"#F4E7E1"],[0.074486109244106591,"#F4E7E0"],[0.074806773595417209,"#F4E7E0"],[0.0749278834908359,"#F4E7E0"],[0.075120649555849739,"#F4E7E0"],[0.075427730211787503,"#F4E7E0"],[0.075441935182968822,"#F4E7E0"],[0.075728008790202916,"#F4E7E0"],[0.075949367088607445,"#F4E7E0"],[0.076021478659389241,"#F4E7E0"],[0.076308133329679118,"#F4E7E0"],[0.076450168296296805,"#F4E7E0"],[0.07658796645414867,"#F4E7E0"],[0.076860971829308178,"#F4E7E0"],[0.076944328013638152,"#F4E7E0"],[0.077127143395778419,"#F4E7E0"],[0.077386475238951813,"#F4E7E0"],[0.077431835568389062,"#F4E7E0"],[0.077638961589640787,"#F4E6E0"],[0.07788459682470894,"#F4E6E0"],[0.077912680409554791,"#F4E6E0"],[0.078123375467690326,"#F4E6DF"],[0.078355292189390968,"#F4E6DF"],[0.078386852108470628,"#F4E6DF"],[0.078580341808477283,"#F4E6DF"],[0.078798519292047176,"#F4E6DF"],[0.078854340359876485,"#F4E6DF"],[0.07900981975618826,"#F4E6DF"],[0.07921423846651765,"#F4E6DF"],[0.079315134982982038,"#F4E6DF"],[0.079411770838707985,"#F4E6DF"],[0.079602412438996906,"#F4E6DF"],[0.079769225922522558,"#F4E6DF"],[0.079786158984680777,"#F4E6DF"],[0.079963006344591636,"#F4E6DF"],[0.080132950539558045,"#F4E6DF"],[0.080216603249806395,"#F4E6DF"],[0.08029598774285085,"#F4E6DF"],[0.080452114280610276,"#F4E6DF"],[0.080601326632258274,"#F4E6DF"],[0.080657257163751273,"#F4E6DF"],[0.080743621430893198,"#F4E6DF"],[0.080878995463667502,"#F4E6DF"],[0.081007445672149681,"#F4E6DF"],[0.081091177991912011,"#F4E6DF"],[0.08112896915266754,"#F4E6DF"],[0.081243563156636389,"#F3E6DF"],[0.081351225090867341,"#F3E6DF"],[0.081451952517861526,"#F3E6DF"],[0.081518356191497388,"#F3E6DF"],[0.081545743156084094,"#F3E6DF"],[0.081632594880222897,"#F3E5DF"],[0.081712505721428186,"#F3E5DF"],[0.081785473867536096,"#F3E5DE"],[0.081851497663273043,"#F3E5DE"],[0.081910575610443903,"#F3E5DE"],[0.081938782350376882,"#F3E5DE"],[0.081962706368101768,"#F3E5DE"],[0.082007888752699487,"#F3E5DE"],[0.082046121738224564,"#F3E5DE"],[0.082077404456315506,"#F3E5DE"],[0.082101736196359743,"#F3E5DE"],[0.082119116405575454,"#F3E5DE"],[0.082129544689072964,"#F3E5DE"],[0.082133020809901147,"#F3E5DE"],[0.082352447188077438,"#F3E5DE"],[0.082759341556768007,"#F3E5DE"],[0.083159456442234103,"#F3E5DE"],[0.083552782964841033,"#F3E5DE"],[0.083939312380485465,"#F3E5DE"],[0.08431903608153446,"#F3E5DE"],[0.084691945597754059,"#F3E5DE"],[0.084914707739982775,"#F3E5DE"],[0.085058032597224553,"#F3E5DE"],[0.085417288887243314,"#F3E5DE"],[0.08546228255745425,"#F3E5DD"],[0.085769706415215419,"#F3E4DD"],[0.086003203709277609,"#F3E4DD"],[0.086115277269532053,"#F3E4DD"],[0.086453993680433383,"#F3E4DD"],[0.086537459375235826,"#F3E4DD"],[0.086785848020861422,"#F3E4DD"],[0.087065037853267357,"#F3E4DD"],[0.087110832807297145,"#F3E4DD"],[0.087428940700583824,"#F3E4DD"],[0.087585927560668742,"#F3E4DD"],[0.087740164506738494,"#F3E4DD"],[0.088044497177746872,"#F3E4DD"],[0.088100117035287306,"#F3E4DD"],[0.088341931812345176,"#F3E4DD"],[0.088607594936709,"#F3E4DD"],[0.088632461656787398,"#F3E4DD"],[0.088916080105597706,"#F3E4DD"],[0.089108350047435225,"#F3E4DC"],[0.08919278070230785,"#F3E4DC"],[0.089462557140179255,"#F3E4DC"],[0.089602371274055015,"#F2E3DC"],[0.089725403262910786,"#F2E3DC"],[0.089981313065329749,"#F2E3DC"],[0.090089647648405213,"#F2E3DC"],[0.090230280694067799,"#F2E3DC"],[0.09047230044822141,"#F2E3DC"],[0.090570168328723999,"#F2E3DC"],[0.090707366779996357,"#F2E3DC"],[0.090935474295334884,"#F2E3DC"],[0.091043922600794858,"#F2E3DC"],[0.091156617754527658,"#F2E3DC"],[0.091370792072809293,"#F2E3DC"],[0.091510899879081564,"#F2E3DC"],[0.091577992320936663,"#F2E3DC"],[0.091778213725750346,"#F2E3DC"],[0.091971089707852505,"#F2E3DC"],[0.091971451670720072,"#F2E3DC"],[0.092157701696471861,"#F2E3DC"],[0.09233695950129861,"#F2E3DC"],[0.092424481762296784,"#F2E3DC"],[0.092509220941653592,"#F2E3DC"],[0.09267448203262596,"#F2E3DC"],[0.092832738948398275,"#F2E3DB"],[0.092871065849628787,"#F2E3DB"],[0.092983988022687369,"#F2E3DB"],[0.093128225749166793,"#F2E3DB"],[0.093265448781870819,"#F2E3DB"],[0.093310831910183523,"#F2E3DB"],[0.093395653935581247,"#F2E3DB"],[0.093518838186195663,"#F2E3DB"],[0.09363499867107683,"#F2E2DB"],[0.093743770018500316,"#F2E2DB"],[0.093744132689384863,"#F2E2DB"],[0.093846237702389756,"#F2E2DB"],[0.093941311333766375,"#F2E2DB"],[0.09402935136987034,"#F2E2DB"],[0.094110355759994824,"#F2E2DB"],[0.094169870384397059,"#F2E2DB"],[0.094184322616609584,"#F2E2DB"],[0.094251250215580007,"#F2E2DB"],[0.094311136996368061,"#F2E2DB"],[0.094363981562214261,"#F2E2DB"],[0.094409782680299981,"#F2E2DB"],[0.094448539281891897,"#F2E2DB"],[0.094480250462465221,"#F2E2DB"],[0.094504915481810947,"#F2E2DB"],[0.094522533764121341,"#F2E2DB"],[0.094533104898056664,"#F2E2DB"],[0.094536628636794351,"#F2E2DB"],[0.094589123354031246,"#F2E2DB"],[0.095001519410952029,"#F2E2DB"],[0.095407049177138825,"#F2E2DB"],[0.09580570341402872,"#F2E2DB"],[0.096197473023531876,"#F2E2DB"],[0.096582349049033844,"#F2E2DA"],[0.096960322676386324,"#F2E2DA"],[0.0970157169407877,"#F2E2DA"],[0.097331385234884271,"#F2E2DA"],[0.097570634361680231,"#F2E2DA"],[0.097695528198229575,"#F2E1DA"],[0.098052743185482738,"#F1E1DA"],[0.098118817708749972,"#F1E1DA"],[0.098403021961998793,"#F1E1DA"],[0.098660254695263183,"#F1E1DA"],[0.098746356440351901,"#F1E1DA"],[0.099082738681243399,"#F1E1DA"],[0.099194933156337761,"#F1E1DA"],[0.09941216089439775,"#F1E1DA"],[0.099722841050222,"#F1E1DA"],[0.099734615439441621,"#F1E1DA"],[0.10005009482677096,"#F1E1DA"],[0.10024396645956557,"#F1E1D9"],[0.10035859171840023,"#F1E1D9"],[0.10066009892879868,"#F1E1D9"],[0.10075829759268362,"#F1E1D9"],[0.10095460942570933,"#F1E1D9"],[0.10124211633095459,"#F1E1D9"],[0.10126582278481011,"#F1E1D9"],[0.10152261292122322,"#F1E1D9"],[0.10176653049934614,"#F1E0D9"],[0.10179609262884359,"#F1E0D9"],[0.10206254904253953,"#F1E0D9"],[0.10226040932909608,"#F1E0D9"],[0.10232197590816938,"#F1E0D9"],[0.10257436712945045,"#F1E0D9"],[0.10274744799749713,"#F1E0D9"],[0.10281971676866308,"#F1E0D9"],[0.10305801904734124,"#F1E0D9"],[0.10322763535983759,"#F1E0D9"],[0.10328926834694374,"#F1E0D9"],[0.1035134592095085,"#F1E0D9"],[0.10370096040446697,"#F1E0D9"],[0.10373058633828991,"#F1E0D9"],[0.10394064459837704,"#F1E0D8"],[0.1041436290172959,"#F1E0D8"],[0.10416741225399506,"#F1E0D8"],[0.10433953478559133,"#F1E0D8"],[0.10452835725739262,"#F1E0D8"],[0.10462698016648164,"#F1E0D8"],[0.10471009195095982,"#F1E0D8"],[0.10488473454921132,"#F1E0D8"],[0.10505228090023311,"#F1E0D8"],[0.10507965353661386,"#F1E0D8"],[0.10521272701776962,"#F1E0D8"],[0.10536606908169399,"#F1E0D8"],[0.10551230343846207,"#F1E0D8"],[0.10552542189687575,"#F1E0D8"],[0.10565142660154381,"#F1DFD8"],[0.10578343525183787,"#F1DFD8"],[0.10590832623806634,"#F1DFD8"],[0.10596427491870364,"#F1DFD8"],[0.10602609657714812,"#F1DFD8"],[0.10613674345455559,"#F1DFD8"],[0.10624026422464883,"#F0DFD8"],[0.10633665641099133,"#F0DFD8"],[0.1063962024136319,"#F0DFD8"],[0.10642591770664622,"#F0DFD8"],[0.1065080459744504,"#F0DFD8"],[0.10658303924727164,"#F0DFD8"],[0.10665089572824249,"#F0DFD8"],[0.1067116137909756,"#F0DFD8"],[0.10676519197975887,"#F0DFD8"],[0.10681162900972963,"#F0DFD8"],[0.10682119433442649,"#F0DFD8"],[0.10685092376702809,"#F0DFD8"],[0.10688307530893171,"#F0DFD8"],[0.10690808286396758,"#F0DFD8"],[0.10692594583200532,"#F0DFD8"],[0.10693666378432864,"#F0DFD8"],[0.10694023646368767,"#F0DFD8"],[0.10723924077620672,"#F0DFD8"],[0.1076503319775538,"#F0DFD7"],[0.1080544583216092,"#F0DFD7"],[0.10845161033715733,"#F0DFD7"],[0.10884177869969658,"#F0DFD7"],[0.10910840290888091,"#F0DFD7"],[0.10922495423249812,"#F0DFD7"],[0.10960112790764853,"#F0DFD7"],[0.10967085733309534,"#F0DFD7"],[0.10997029084708043,"#F0DED7"],[0.11022649551323005,"#F0DED7"],[0.11033243432358886,"#F0DED7"],[0.11068754976183171,"#F0DED7"],[0.11077530467175334,"#F0DED7"],[0.11103562873931794,"#F0DED7"],[0.1113172721568062,"#F0DED6"],[0.11137666298737836,"#F0DED6"],[0.11171064439212319,"#F0DED6"],[0.11185238544356324,"#F0DED6"],[0.11203756499538298,"#F0DED6"],[0.11235741699563406,"#F0DED6"],[0.11238063213558691,"#F0DED6"],[0.11267019274890888,"#F0DED6"],[0.112901999966174,"#F0DED6"],[0.11297588476968856,"#F0DED6"],[0.11327448573178112,"#F0DED6"],[0.11341647679969291,"#F0DED6"],[0.11356598846918109,"#F0DED6"],[0.11385038597691388,"#F0DDD6"],[0.11392405063291144,"#F0DDD6"],[0.11412767141186109,"#F0DDD6"],[0.11439783809357129,"#F0DDD6"],[0.11442470959631723,"#EFDDD6"],[0.11466087950504988,"#EFDDD6"],[0.11491678929353477,"#EFDDD5"],[0.11491844195542666,"#EFDDD5"],[0.11516556127125088,"#EFDDD5"],[0.11540523611208642,"#EFDDD5"],[0.11540718941614814,"#EFDDD5"],[0.11564166787262187,"#EFDDD5"],[0.11586899095221193,"#EFDDD5"],[0.11588508060576197,"#EFDDD5"],[0.11608915313428569,"#EFDDD5"],[0.11630214906670133,"#EFDDD5"],[0.11635796411481836,"#EFDDD5"],[0.11650797356645093,"#EFDDD5"],[0.11670662162028544,"#EFDDD5"],[0.11682387545778883,"#EFDDD5"],[0.11689808838531979,"#EFDDD5"],[0.11708236918961834,"#EFDDD5"],[0.11725945953276018,"#EFDDD5"],[0.11728280359463239,"#EFDDD5"],[0.1174293550863853,"#EFDDD5"],[0.1175920516947192,"#EFDDD5"],[0.11773473762798115,"#EFDCD5"],[0.11774754537507881,"#EFDCD5"],[0.11789583231835687,"#EFDCD5"],[0.11803690888948626,"#EFDCD5"],[0.11817077162788348,"#EFDCD5"],[0.11817966680437419,"#EFDCD5"],[0.11829741724787113,"#EFDCD5"],[0.11841684263907981,"#EFDCD5"],[0.11852904486682858,"#EFDCD5"],[0.11861758051548132,"#EFDCD4"],[0.11863402117248467,"#EFDCD4"],[0.11873176897380155,"#EFDCD4"],[0.1188222858652358,"#EFDCD4"],[0.11890556961824272,"#EFDCD4"],[0.11898161818154973,"#EFDCD4"],[0.11904846829931359,"#EFDCD4"],[0.11905042968140889,"#EFDCD4"],[0.11911200242182785,"#EFDCD4"],[0.11916633488477768,"#EFDCD4"],[0.11921342573038074,"#EFDCD4"],[0.11925327379707529,"#EFDCD4"],[0.11928587810175884,"#EFDCD4"],[0.11931123783990949,"#EFDCD4"],[0.11932935238568498,"#EFDCD4"],[0.11934022129199984,"#EFDCD4"],[0.11934384429058087,"#EFDCD4"],[0.11947231984142082,"#EFDCD4"],[0.11988912497607718,"#EFDCD4"],[0.12029887368745329,"#EFDCD4"],[0.1207015561107746,"#EFDCD4"],[0.12109716253346547,"#EFDCD4"],[0.12119242205280401,"#EFDCD4"],[0.12148568339628063,"#EFDCD4"],[0.12176261547811706,"#EFDBD4"],[0.12186710929442068,"#EFDBD4"],[0.12224143097863427,"#EFDBD4"],[0.12232590867878512,"#EFDBD3"],[0.12260863935630384,"#EFDBD3"],[0.12288228836064141,"#EEDBD3"],[0.12296872549251714,"#EEDBD3"],[0.12332168061112347,"#EEDBD3"],[0.12343174135913859,"#EEDBD3"],[0.12366749609577266,"#EEDBD3"],[0.12397425464080036,"#EEDBD3"],[0.12400616349093985,"#EEDBD3"],[0.12433767450293154,"#EEDBD3"],[0.12450981530466465,"#EEDBD3"],[0.12466202100087764,"#EEDBD3"],[0.12497919501770482,"#EEDBD3"],[0.12503841058371834,"#EEDBD3"],[0.12528918875109241,"#EEDBD3"],[0.12556002784632403,"#EEDBD3"],[0.12559199456441239,"#EEDBD3"],[0.12588760498765084,"#EEDAD3"],[0.12607465459763711,"#EEDAD2"],[0.1261760127183108,"#EEDAD2"],[0.12645721062229764,"#EEDAD2"],[0.12658227848101267,"#EEDAD2"],[0.12673119173478686,"#EEDAD2"],[0.12699794926107022,"#EEDAD2"],[0.1270828872794042,"#EEDAD2"],[0.12725747657738695,"#EEDAD2"],[0.12750976723173246,"#EEDAD2"],[0.12757646891675045,"#EEDAD2"],[0.12775481494464902,"#EEDAD2"],[0.12799261360999736,"#EEDAD2"],[0.12806301145935317,"#EEDAD2"],[0.12822315729570721,"#EEDAD2"],[0.12844644024450835,"#EEDAD2"],[0.1285425031172428,"#EEDAD2"],[0.12866245687464162,"#EEDAD2"],[0.12887120178054945,"#EEDAD2"],[0.12901493224553418,"#EEDAD2"],[0.12907266973354492,"#EEDAD2"],[0.12926685568246132,"#EEDAD2"],[0.12945375475427923,"#EEDAD2"],[0.12948028734576922,"#EEDAD2"],[0.12963336225473365,"#EEDAD2"],[0.12980567366889884,"#EEDAD1"],[0.12993855706724977,"#EED9D1"],[0.1299706846617521,"#EED9D1"],[0.13012839107871554,"#EED9D1"],[0.13027878894617628,"#EED9D1"],[0.13038973020835554,"#EED9D1"],[0.13042187447198417,"#EED9D1"],[0.13055764404592773,"#EED9D1"],[0.13068609424018773,"#EED9D1"],[0.13080722180976778,"#EED9D1"],[0.13083379571785225,"#EDD9D1"],[0.13092102369290348,"#EDD9D1"],[0.13102749701144767,"#EDD9D1"],[0.13112663907123356,"#EDD9D1"],[0.13121844736241473,"#EDD9D1"],[0.13127074269618522,"#EDD9D1"],[0.13130291955978213,"#EDD9D1"],[0.13138005352305782,"#EDD9D1"],[0.13144984729716647,"#EDD9D1"],[0.13151229911248197,"#EDD9D1"],[0.13156740738505157,"#EDD9D1"],[0.13161517071679751,"#EDD9D1"],[0.13165558789569276,"#EDD9D1"],[0.13168865789591633,"#EDD9D1"],[0.13170056039675959,"#EDD9D1"],[0.13171437987798185,"#EDD9D1"],[0.13173275318884559,"#EDD9D1"],[0.13174377736198806,"#EDD9D1"],[0.13174745211747407,"#EDD9D1"],[0.13212323822720828,"#EDD9D1"],[0.1325387657506446,"#EDD9D1"],[0.13294713268690161,"#EDD9D1"],[0.13326741187289182,"#EDD9D1"],[0.13334832891375692,"#EDD9D1"],[0.13374234446814137,"#EDD9D0"],[0.13384555428264644,"#EDD9D0"],[0.13412916954733434,"#EDD8D0"],[0.13441671062767235,"#EDD8D0"],[0.13450879451014186,"#EDD8D0"],[0.13488120987806029,"#EDD8D0"],[0.1349808670696564,"#EDD8D0"],[0.13524640633642238,"#EDD8D0"],[0.13553800990398046,"#EDD8D0"],[0.13560437473552833,"#EDD8D0"],[0.13595510609175832,"#EDD8D0"],[0.13608812556127015,"#EDD8D0"],[0.13629859158867064,"#EDD8D0"],[0.13663120060893397,"#EDD8D0"],[0.13663482257807857,"#EDD8D0"],[0.13696379058111363,"#EDD8D0"],[0.13716722175269425,"#EDD8CF"],[0.13728548728926793,"#EDD8CF"],[0.13759990456541926,"#EDD8CF"],[0.13769617583810978,"#EDD8CF"],[0.13790703444483743,"#EDD7CF"],[0.13820686913617297,"#EDD7CF"],[0.1382180498520883,"#EDD7CF"],[0.1384994010224242,"#EDD7CF"],[0.13873283092438859,"#EDD7CF"],[0.13878462266188685,"#EDD7CF"],[0.13906252678908337,"#ECD7CF"],[0.139240506329114,"#ECD7CF"],[0.13933310631567275,"#ECD7CF"],[0.13959635433133921,"#ECD7CF"],[0.13974106348619419,"#ECD7CF"],[0.13985226410466101,"#ECD7CF"],[0.14010082908395849,"#ECD7CF"],[0.14023448996285581,"#ECD7CF"],[0.14034204289812136,"#ECD7CF"],[0.14057589935741432,"#ECD7CF"],[0.14072077347508316,"#ECD7CF"],[0.14080239245426118,"#ECD7CF"],[0.14102151636400828,"#ECD7CE"],[0.14119990188906584,"#ECD7CE"],[0.14123326544566461,"#ECD7CE"],[0.14143763424262124,"#ECD7CE"],[0.14163461748334716,"#ECD7CE"],[0.14167186322263503,"#ECD7CE"],[0.14182421008206325,"#ECD7CE"],[0.14200640713939372,"#ECD6CE"],[0.14213664564668693,"#ECD6CE"],[0.14218120394299416,"#ECD6CE"],[0.14234859596815663,"#ECD6CE"],[0.1425085788783913,"#ECD6CE"],[0.14259423748659406,"#ECD6CE"],[0.14266114852598577,"#ECD6CE"],[0.14280630095253866,"#ECD6CE"],[0.14294403238947129,"#ECD6CE"],[0.14304462722360245,"#ECD6CE"],[0.1430743392585142,"#ECD6CE"],[0.14319721817217101,"#ECD6CE"],[0.14331266593415615,"#ECD6CE"],[0.14342067953980964,"#ECD6CE"],[0.14348780349621637,"#ECD6CE"],[0.14352125617648714,"#ECD6CE"],[0.14361439322392544,"#ECD6CE"],[0.14370008825458203,"#ECD6CE"],[0.14377833903395199,"#ECD6CE"],[0.14384914352085854,"#ECD6CE"],[0.14391249986771837,"#ECD6CE"],[0.14392375510156818,"#ECD6CE"],[0.14396840642078346,"#ECD6CE"],[0.14401686172035555,"#ECD6CE"],[0.14405786450097757,"#ECD6CE"],[0.14409141369159795,"#ECD6CE"],[0.14411750841571136,"#ECD6CE"],[0.14413614799147279,"#ECD6CE"],[0.14414733193178564,"#ECD6CE"],[0.14415105994436728,"#ECD6CE"],[0.14435247099677451,"#ECD6CE"],[0.14477394030027724,"#ECD6CD"],[0.14518815229317061,"#ECD6CD"],[0.14533298966213681,"#ECD6CD"],[0.14559509642051083,"#ECD6CD"],[0.14591929943694326,"#ECD6CD"],[0.14599476229261288,"#ECD5CD"],[0.14638713968632866,"#ECD5CD"],[0.14649853539729385,"#ECD5CD"],[0.14677221854630973,"#ECD5CD"],[0.14707068313141614,"#ECD5CD"],[0.14714998898625364,"#EBD5CD"],[0.14752044129013253,"#EBD5CD"],[0.14763572836543859,"#EBD5CD"],[0.14788356591340424,"#EBD5CD"],[0.14819365696504394,"#EBD5CD"],[0.14823935348420614,"#EBD5CD"],[0.14858779480453033,"#EBD5CC"],[0.14874445493711064,"#EBD5CC"],[0.14892888085138012,"#EBD5CC"],[0.14926260277790859,"#EBD5CC"],[0.14928810843135021,"#EBD5CC"],[0.1495889519145378,"#EBD5CC"],[0.1498246037419303,"#EBD5CC"],[0.14990791977005657,"#EBD5CC"],[0.15021949803270185,"#EBD4CC"],[0.15035392730909203,"#EBD4CC"],[0.15052367857121784,"#EBD4CC"],[0.15082045343589423,"#EBD4CC"],[0.15087606572075496,"#EBD4CC"],[0.15110981485958541,"#EBD4CC"],[0.15139100571411246,"#EBD4CC"],[0.15139175525870807,"#EBD4CC"],[0.15166626723421672,"#EBD4CC"],[0.15189873417721511,"#EBD4CC"],[0.15193334357255806,"#EBD4CC"],[0.15219297724660452,"#EBD4CB"],[0.15239923815054512,"#EBD4CB"],[0.15244516141656417,"#EBD4CB"],[0.15268988943086848,"#EBD4CB"],[0.15289250482857553,"#EBD4CB"],[0.15292715482703856,"#EBD4CB"],[0.15315695133252694,"#EBD4CB"],[0.15337852156132037,"#EBD4CB"],[0.15337927286553743,"#EBD4CB"],[0.15359411353581975,"#EBD4CB"],[0.15380146764544345,"#EBD4CB"],[0.15385727585587039,"#EBD4CB"],[0.15400132968954483,"#EBD4CB"],[0.15419369435705133,"#EBD3CB"],[0.15432875537791668,"#EBD3CB"],[0.15437855653138133,"#EBD3CB"],[0.15455591129111934,"#EBD3CB"],[0.15472575391066656,"#EBD3CB"],[0.15479294795325982,"#EBD3CB"],[0.15488807986086572,"#EBD3CB"],[0.1550428848096016,"#EBD3CB"],[0.155190164622376,"#EAD3CB"],[0.15524984156930743,"#EAD3CB"],[0.15532991536285701,"#EAD3CB"],[0.15546213329340253,"#EAD3CB"],[0.15558681487555814,"#EAD3CB"],[0.15569942437655426,"#EAD3CB"],[0.15570395677052862,"#EAD3CB"],[0.15581355583962375,"#EAD3CA"],[0.15591560914467739,"#EAD3CA"],[0.15601011394844078,"#EAD3CA"],[0.15609706771494791,"#EAD3CA"],[0.15614168469005085,"#EAD3CA"],[0.15617646810985619,"#EAD3CA"],[0.15624831300075848,"#EAD3CA"],[0.15631260045746942,"#EAD3CA"],[0.15636932875228426,"#EAD3CA"],[0.15641849636021099,"#EAD3CA"],[0.15646010195917504,"#EAD3CA"],[0.15649414443019671,"#EAD3CA"],[0.15652062285754231,"#EAD3CA"],[0.15653953652884667,"#EAD3CA"],[0.15655088493520863,"#EAD3CA"],[0.15655466777126059,"#EAD3CA"],[0.15657661099085496,"#EAD3CA"],[0.15700419192746906,"#EAD3CA"],[0.15738875110021622,"#EAD3CA"],[0.15742441631726034,"#EAD3CA"],[0.15783727314786611,"#EAD3CA"],[0.15798345545537296,"#EAD3CA"],[0.15824275157858214,"#EAD2CA"],[0.15857099628574922,"#EAD2CA"],[0.1586408409417337,"#EAD2CA"],[0.15903153074402843,"#EAD2CA"],[0.15915135857486129,"#EAD2CA"],[0.15941481066789376,"#EAD2CA"],[0.15972452744846322,"#EAD2C9"],[0.1597906705727935,"#EAD2C9"],[0.16015910049652782,"#EAD2C9"],[0.16029048817631131,"#EAD2C9"],[0.16052009065651318,"#EAD2C9"],[0.16084922617391995,"#EAD2C9"],[0.16087363145104405,"#EAD2C9"],[0.16121971346053321,"#EAD2C9"],[0.16140072700430852,"#EAD2C9"],[0.16155832744873422,"#EAD2C9"],[0.16188946436394203,"#EAD2C9"],[0.16194497637973782,"#EAD2C9"],[0.16221311534017291,"#EAD1C9"],[0.16248196016343874,"#EAD1C9"],[0.16252927169832443,"#EAD1C9"],[0.16283792494731264,"#EAD1C9"],[0.16301166437132719,"#EAD1C9"],[0.16313906678518808,"#EAD1C9"],[0.16343268910022968,"#E9D1C8"],[0.16353407517371166,"#E9D1C8"],[0.163718783972017,"#E9D1C8"],[0.16399734367247776,"#E9D1C8"],[0.16404917889698667,"#E9D1C8"],[0.16426836066691441,"#E9D1C8"],[0.16453182761500595,"#E9D1C8"],[0.16455696202531644,"#E9D1C8"],[0.16478773737178654,"#E9D1C8"],[0.1650360829886004,"#E9D1C8"],[0.16505741120230477,"#E9D1C8"],[0.16527685771403133,"#E9D1C8"],[0.16551005499480964,"#E9D1C8"],[0.16555051323265357,"#E9D1C8"],[0.16573566847669197,"#E9D1C8"],[0.16595369200531773,"#E9D1C8"],[0.16603625508380704,"#E9D1C8"],[0.16616411962703892,"#E9D1C8"],[0.16636694558972531,"#E9D0C8"],[0.16651462388758387,"#E9D0C8"],[0.16656216434354321,"#E9D0C8"],[0.16674977054170814,"#E9D0C8"],[0.16692975904121077,"#E9D0C7"],[0.16698560694179287,"#E9D0C7"],[0.16710212490351695,"#E9D0C7"],[0.16726686339524099,"#E9D0C7"],[0.16742396998879083,"#E9D0C7"],[0.16744919171183759,"#E9D0C7"],[0.16757344036298683,"#E9D0C7"],[0.1677152704036533,"#E9D0C7"],[0.16784945620418168,"#E9D0C7"],[0.16790536583230264,"#E9D0C7"],[0.16797599406606623,"#E9D0C7"],[0.16809488049941224,"#E9D0C7"],[0.16820611222341519,"#E9D0C7"],[0.16830968616681208,"#E9D0C7"],[0.16835411710852688,"#E9D0C7"],[0.16840559946830469,"#E9D0C7"],[0.16849384947695378,"#E9D0C7"],[0.16857443375254444,"#E9D0C7"],[0.16864735006592313,"#E9D0C7"],[0.1687125963993058,"#E9D0C7"],[0.16877017094655633,"#E9D0C7"],[0.16879543351815995,"#E9D0C7"],[0.16882007211343641,"#E9D0C7"],[0.16886229851782608,"#E9D0C7"],[0.16889684898991542,"#E9D0C7"],[0.16892372257236576,"#E9D0C7"],[0.1689429185204433,"#E9D0C7"],[0.16895443630212115,"#E9D0C7"],[0.1689582755981538,"#E9D0C7"],[0.16922930321270246,"#E9D0C7"],[0.16943426873046818,"#E9D0C7"],[0.1696557145190305,"#E9D0C7"],[0.17003760418094083,"#E9D0C7"],[0.17007465594090077,"#E9D0C7"],[0.1704861161604414,"#E9CFC7"],[0.17063368438403803,"#E9CFC7"],[0.1708900840396218,"#E9CFC6"],[0.17122249368522302,"#E9CFC6"],[0.171286548621706,"#E8CFC6"],[0.17167549913268587,"#E8CFC6"],[0.17180401657666367,"#E8CFC6"],[0.17205692498269654,"#E8CFC6"],[0.17237823769911875,"#E8CFC6"],[0.17243081576741048,"#E8CFC6"],[0.17279716126941325,"#E8CFC6"],[0.17294514184381471,"#E8CFC6"],[0.17315595145955698,"#E8CFC6"],[0.17350471395431355,"#E8CFC6"],[0.17350717649829384,"#E8CFC6"],[0.17385082673698915,"#E8CFC6"],[0.17405693912837017,"#E8CFC6"],[0.17418689271921073,"#E8CFC6"],[0.17451536518199773,"#E8CEC5"],[0.1746018026197812,"#E8CEC5"],[0.17483623505710633,"#E8CEC5"],[0.1751392898402212,"#E8CEC5"],[0.17514949347223308,"#E8CEC5"],[0.17545513175221428,"#E8CEC5"],[0.17566938636106888,"#E8CEC5"],[0.17575314142020215,"#E8CEC5"],[0.17604351419881759,"#E8CEC5"],[0.17619207791522118,"#E8CEC5"],[0.176326242011277,"#E8CEC5"],[0.1766013169824967,"#E8CEC5"],[0.17670735039889529,"#E8CEC5"],[0.17686873144017035,"#E8CEC5"],[0.17712847791582187,"#E8CEC5"],[0.17721518987341778,"#E8CEC5"],[0.17738054914583268,"#E8CEC5"],[0.17762493807244273,"#E8CEC5"],[0.17771558256700082,"#E8CEC5"],[0.17786163784472508,"#E8CEC5"],[0.17809064181953471,"#E8CEC5"],[0.17820851487650502,"#E8CEC4"],[0.17831194356242897,"#E8CEC4"],[0.17852553684856187,"#E8CDC4"],[0.17869397336918635,"#E8CDC4"],[0.17873141566355022,"#E8CDC4"],[0.17892957420431266,"#E8CDC4"],[0.17912000687988006,"#E8CDC4"],[0.17917194478443166,"#E8CDC4"],[0.17930270831217709,"#E7CDC4"],[0.179477673336777,"#E7CDC4"],[0.17964241603547582,"#E7CDC4"],[0.17964489700362529,"#E7CDC4"],[0.17980437457773635,"#E7CDC4"],[0.17995610153985886,"#E7CDC4"],[0.18010007358711388,"#E7CDC4"],[0.18010537421110451,"#E7CDC4"],[0.18023628663360047,"#E7CDC4"],[0.18036473681097476,"#E7CDC4"],[0.18048542046899541,"#E7CDC4"],[0.18056080657734175,"#E7CDC4"],[0.18059833417604165,"#E7CDC4"],[0.18070347471959891,"#E7CDC4"],[0.18080083910671529,"#E7CDC4"],[0.1808904245644255,"#E7CDC4"],[0.18097222854014627,"#E7CDC4"],[0.18100870057911944,"#E7CDC4"],[0.18104624870203823,"#E7CDC4"],[0.18111248293933824,"#E7CDC4"],[0.18117092936266033,"#E7CDC4"],[0.18122158630426421,"#E7CDC4"],[0.1812644523182938,"#E7CDC4"],[0.18129952618098244,"#E7CDC4"],[0.18132680689082881,"#E7CDC4"],[0.18134629366873889,"#E7CDC4"],[0.18135798595813712,"#E7CDC4"],[0.181361883425047,"#E7CDC4"],[0.18144904384193017,"#E7CDC4"],[0.18146909030851011,"#E7CDC4"],[0.18188182417346288,"#E7CDC4"],[0.18208130316345106,"#E7CDC3"],[0.18230702956522071,"#E7CDC3"],[0.18268616698389284,"#E7CCC3"],[0.18272464819411849,"#E7CCC3"],[0.18313466842406378,"#E7CCC3"],[0.18328366544165053,"#E7CCC3"],[0.18353707880751691,"#E7CCC3"],[0.18387378235984053,"#E7CCC3"],[0.18393186808703044,"#E7CCC3"],[0.18431902519677035,"#E7CCC3"],[0.18445650171489802,"#E7CCC3"],[0.18469853926401403,"#E7CCC3"],[0.18503180763858429,"#E7CCC3"],[0.1850703996106291,"#E7CCC3"],[0.18543459575452781,"#E7CCC3"],[0.18559968441998576,"#E7CCC3"],[0.18579111741110244,"#E7CCC2"],[0.18613995449463483,"#E7CCC2"],[0.18616011650750208,"#E7CCC2"],[0.18648109711968508,"#E7CCC2"],[0.18671308851082558,"#E7CBC2"],[0.18681453560245598,"#E7CBC2"],[0.1871402604621325,"#E7CBC2"],[0.18725858520290695,"#E6CBC2"],[0.18745826242219876,"#E6CBC2"],[0.18776853241172864,"#E6CBC2"],[0.18779659152191286,"#E6CBC2"],[0.18807106156665165,"#E6CBC2"],[0.18832709257316793,"#E6CBC2"],[0.18836584123099331,"#E6CBC2"],[0.18865286295808981,"#E6CBC2"],[0.18885007363108686,"#E6CBC2"],[0.18893211851177494,"#E6CBC2"],[0.18920359986754187,"#E6CBC2"],[0.18936552014109231,"#E6CBC2"],[0.18946729921367722,"#E6CBC1"],[0.18972320895236627,"#E6CBC1"],[0.18987341772151889,"#E6CBC1"],[0.18997132170077302,"#E6CBC1"],[0.19021163029208876,"#E6CBC1"],[0.19037375216550367,"#E6CBC1"],[0.19044412777655484,"#E6CBC1"],[0.19066880742245484,"#E6CBC1"],[0.19086650944286065,"#E6CAC1"],[0.19088566271707796,"#E6CAC1"],[0.19109468736765312,"#E6CAC1"],[0.19129587530225256,"#E6CAC1"],[0.19135167570194167,"#E6CAC1"],[0.19148922067066609,"#E6CAC1"],[0.1916747178452437,"#E6CAC1"],[0.19182923727148049,"#E6CAC1"],[0.19185236142170914,"#E6CAC1"],[0.1920221462199404,"#E6CAC1"],[0.19218406728472048,"#E6CAC1"],[0.19229918066241958,"#E6CAC1"],[0.19233811988645588,"#E6CAC1"],[0.19248429952186374,"#E6CAC1"],[0.19262260191462688,"#E6CAC1"],[0.19275302301601549,"#E6CAC1"],[0.1927614925697223,"#E6CAC1"],[0.19287555900547892,"#E6CAC1"],[0.19299020629120189,"#E6CAC1"],[0.19309696151063005,"#E6CAC1"],[0.19319582153096115,"#E6CAC0"],[0.19321615987416541,"#E6CAC0"],[0.19328678344960404,"#E6CAC0"],[0.19336984459460416,"#E6CAC0"],[0.19344500252503383,"#E6CAC0"],[0.19349273700994463,"#E6CAC0"],[0.19351225503135239,"#E6CAC0"],[0.19357160013572927,"#E6CAC0"],[0.19362303609233478,"#E6CAC0"],[0.19366316964411445,"#E6CAC0"],[0.19366656138759675,"#E6CAC0"],[0.19370217474042351,"#E6CAC0"],[0.19372987510239159,"#E6CAC0"],[0.19374966165790064,"#E6CAC0"],[0.19376153382429318,"#E6CAC0"],[0.1937654912519402,"#E6CAC0"],[0.19410250913728089,"#E6CAC0"],[0.19411408389888662,"#E6CAC0"],[0.19453416580246019,"#E6CAC0"],[0.19472798584899675,"#E6CAC0"],[0.19495812728124939,"#E6C9C0"],[0.19533442582041682,"#E5C9C0"],[0.19537438140974539,"#E5C9C0"],[0.19578291622022315,"#E5C9C0"],[0.19593338692931339,"#E5C9C0"],[0.19618371994279094,"#E5C9C0"],[0.19652485245003726,"#E5C9C0"],[0.19657678100702569,"#E5C9C0"],[0.1969620880435855,"#E5C9BF"],[0.19710880581727286,"#E5C9BF"],[0.19733962988579945,"#E5C9BF"],[0.19768523062817844,"#E5C9BF"],[0.19770939557123368,"#E5C9BF"],[0.19807137434323574,"#E5C9BF"],[0.1982541106445167,"#E5C9BF"],[0.19842555565245168,"#E5C9BF"],[0.19877192915832209,"#E5C9BF"],[0.19881542979477396,"#E5C9BF"],[0.1991104847305496,"#E5C8BF"],[0.19936917217626915,"#E5C8BF"],[0.19944121245054369,"#E5C8BF"],[0.19976410261283695,"#E5C8BF"],[0.19991532205724949,"#E5C8BF"],[0.200079145726477,"#E5C8BF"],[0.20038633251638971,"#E5C8BF"],[0.20045386387897601,"#E5C8BF"],[0.20068565392471605,"#E5C8BF"],[0.20097710111212086,"#E5C8BE"],[0.20098478225779359,"#E5C8BE"],[0.20126066545907273,"#E5C8BE"],[0.20150806198718951,"#E5C8BE"],[0.20153633856709618,"#E5C8BE"],[0.20180411225999384,"#E5C8BE"],[0.20202368803983617,"#E5C8BE"],[0.20206397858503944,"#E5C8BE"],[0.20231592981414104,"#E5C8BE"],[0.20253164556962033,"#E5C8BE"],[0.20255995844497332,"#E5C8BE"],[0.20279605720208027,"#E5C8BE"],[0.2030242190379451,"#E5C7BE"],[0.20303191991365621,"#E4C7BE"],[0.20324443713403051,"#E4C7BE"],[0.2034567049017858,"#E4C7BE"],[0.20352449659428318,"#E4C7BE"],[0.20366101598362285,"#E4C7BE"],[0.20385736425385881,"#E4C7BE"],[0.20400936132104586,"#E4C7BE"],[0.20404574381962626,"#E4C7BE"],[0.2042261490217504,"#E4C7BE"],[0.20439857443559273,"#E4C7BE"],[0.20448649999265822,"#E4C7BE"],[0.20456301487186135,"#E4C7BD"],[0.20471946537738606,"#E4C7BD"],[0.20486792123586117,"#E4C7BD"],[0.2049558986989497,"#E4C7BD"],[0.20500837796855187,"#E4C7BD"],[0.20514083133496708,"#E4C7BD"],[0.20526527733349664,"#E4C7BD"],[0.20538171220201418,"#E4C7BD"],[0.20541754372279242,"#E4C7BD"],[0.20549013241844294,"#E4C7BD"],[0.2055047014832061,"#E4C7BD"],[0.20559053470128741,"#E4C7BD"],[0.20568291601012911,"#E4C7BD"],[0.20576727354608526,"#E4C7BD"],[0.2058436047522324,"#E4C7BD"],[0.20587142154200966,"#E4C7BD"],[0.20591190731399323,"#E4C7BD"],[0.20597217915948696,"#E4C7BD"],[0.20602441845984343,"#E4C7BD"],[0.2060686236294802,"#E4C7BD"],[0.20610479332634324,"#E4C7BD"],[0.20613292645211023,"#E4C7BD"],[0.2061354499162279,"#E4C7BD"],[0.20615302215235753,"#E4C7BD"],[0.20616507981668997,"#E4C7BD"],[0.20616909907883341,"#E4C7BD"],[0.20631751883126548,"#E4C7BD"],[0.2067558224639332,"#E4C7BD"],[0.20675865533597371,"#E4C7BD"],[0.20718631951394428,"#E4C6BD"],[0.2073742999502618,"#E4C6BD"],[0.20760899725761517,"#E4C6BD"],[0.20798236612778342,"#E4C6BD"],[0.20802384317545197,"#E4C6BD"],[0.2084308449539346,"#E4C6BC"],[0.2085828364004142,"#E4C6BC"],[0.20882999048727513,"#E4C6BC"],[0.20917569346551756,"#E4C6BC"],[0.20922126787915551,"#E4C6BC"],[0.20960466544443868,"#E4C6BC"],[0.20976092018823922,"#E4C6BC"],[0.2099801717108567,"#E4C6BC"],[0.2103384996037897,"#E4C6BC"],[0.2103477754206734,"#E4C6BC"],[0.21070746553232045,"#E4C6BC"],[0.21090841491971801,"#E3C6BC"],[0.21105923122200787,"#E3C6BC"],[0.21140306188530789,"#E3C5BC"],[0.21147064951817307,"#E3C5BC"],[0.211738947138711,"#E3C5BC"],[0.21202518695815287,"#E3C5BC"],[0.21206687682115399,"#E3C5BB"],[0.21238684099552074,"#E3C5BB"],[0.21257201097774137,"#E3C5BB"],[0.21269882995011247,"#E3C5BB"],[0.21300283420008992,"#E3C5BB"],[0.21311110549633205,"#E3C5BB"],[0.21329884448888581,"#E3C5BB"],[0.21358685178958536,"#E3C5BB"],[0.21364245461683695,"#E3C5BB"],[0.21386684730627781,"#E3C5BB"],[0.21413882247537575,"#E3C5BB"],[0.21416604262788186,"#E3C5BB"],[0.21440276896690336,"#E3C5BB"],[0.21465867868575084,"#E3C5BB"],[0.21468185400598505,"#E3C5BB"],[0.21490654377289897,"#E3C5BB"],[0.2151463566066083,"#E3C5BB"],[0.21518987341772144,"#E3C5BB"],[0.21537810980357586,"#E3C4BB"],[0.21560179622005737,"#E3C4BB"],[0.2156900857218691,"#E3C4BB"],[0.21581740895295753,"#E3C4BB"],[0.21602494134088179,"#E3C4BA"],[0.21618247597153806,"#E3C4BA"],[0.21622438696515622,"#E3C4BA"],[0.21641573965081173,"#E3C4BA"],[0.21659899346753086,"#E3C4BA"],[0.21666702941628313,"#E3C4BA"],[0.21677414273055995,"#E3C4BA"],[0.21694118200158485,"#E3C4BA"],[0.21710010608956976,"#E3C4BA"],[0.2171437315041963,"#E3C4BA"],[0.21725091005155872,"#E3C4BA"],[0.21739358919344065,"#E3C4BA"],[0.21750444573204419,"#E3C4BA"],[0.21752813907067581,"#E3C4BA"],[0.21761256788398009,"#E3C4BA"],[0.21765455548898593,"#E3C4BA"],[0.21777283450500451,"#E3C4BA"],[0.2178829724268907,"#E3C4BA"],[0.21798496581490279,"#E3C4BA"],[0.21807352440700167,"#E3C4BA"],[0.21807881148193464,"#E3C4BA"],[0.21814487469638233,"#E3C4BA"],[0.21816450649401242,"#E3C4BA"],[0.2182420481707521,"#E3C4BA"],[0.21831143408577836,"#E3C4BA"],[0.21837266206710371,"#E3C4BA"],[0.21842573019746725,"#E3C4BA"],[0.21847063681463619,"#E3C4BA"],[0.21850738051166441,"#E3C4BA"],[0.21852658712932671,"#E3C4BA"],[0.21853596013711352,"#E3C4BA"],[0.21855637479523349,"#E3C4BA"],[0.21856862384610232,"#E3C4BA"],[0.21857270690572672,"#E3C4BA"],[0.2187776603500009,"#E2C4BA"],[0.21897174231373029,"#E2C4BA"],[0.21940278410491165,"#E2C3BA"],[0.21940897643168811,"#E2C3BA"],[0.21983827616534446,"#E2C3B9"],[0.22002022753896344,"#E2C3B9"],[0.22025962840945568,"#E2C3B9"],[0.22062997239832249,"#E2C3B9"],[0.22067302027331226,"#E2C3B9"],[0.22107843908263503,"#E2C3B9"],[0.22123200059994075,"#E2C3B9"],[0.22147587238144661,"#E2C3B9"],[0.22182629423401601,"#E2C3B9"],[0.22186530793391757,"#E2C3B9"],[0.22224673372618564,"#E2C3B9"],[0.22241283556644287,"#E2C3B9"],[0.22262013796814994,"#E2C3B9"],[0.22298550909523418,"#E2C3B9"],[0.22299160704125098,"#E2C3B9"],[0.2233428357701267,"#E2C3B9"],[0.22356259128303357,"#E2C2B8"],[0.22369210688448715,"#E2C2B8"],[0.224033311560627,"#E2C2B8"],[0.22412577109936194,"#E2C2B8"],[0.22436643915315935,"#E2C2B8"],[0.22468112948318875,"#E2C2B8"],[0.22469147925061828,"#E2C2B8"],[0.22500842167704738,"#E2C2B8"],[0.22522864961523625,"#E2C2B8"],[0.22531725649355638,"#E2C2B8"],[0.22561797399984707,"#E2C2B8"],[0.22576831486637094,"#E2C2B8"],[0.22591056473570525,"#E2C2B8"],[0.22619501948246001,"#E2C2B8"],[0.22630010879996265,"#E2C2B8"],[0.22647132926441049,"#E2C2B8"],[0.2267394853502166,"#E1C2B8"],[0.2268240151742279,"#E1C2B8"],[0.22699947925425701,"#E1C2B8"],[0.2272513027379508,"#E1C2B7"],[0.22734001794455683,"#E1C2B7"],[0.22749494781104485,"#E1C2B7"],[0.22773040673286327,"#E1C1B7"],[0.22784810126582289,"#E1C1B7"],[0.22795767201352268,"#E1C1B7"],[0.22817673641510894,"#E1C1B7"],[0.22834824949467369,"#E1C1B7"],[0.2283875929528173,"#E1C1B7"],[0.22859023489605457,"#E1C1B7"],[0.22878465576950335,"#E1C1B7"],[0.22884044719180463,"#E1C1B7"],[0.22897084935414735,"#E1C1B7"],[0.22914880968825868,"#E1C1B7"],[0.22931853106834454,"#E1C1B7"],[0.22932467912421151,"#E1C1B7"],[0.22948000805005575,"#E1C1B7"],[0.22949139881037806,"#E1C1B7"],[0.22963323544905434,"#E1C1B7"],[0.22977820834184093,"#E1C1B7"],[0.22980093026742399,"#E1C1B7"],[0.22991492206654274,"#E1C1B7"],[0.23004337222365878,"#E1C1B7"],[0.23014179940614499,"#E1C1B7"],[0.23016355467676508,"#E1C1B7"],[0.23026918580771794,"#E1C1B7"],[0.23027546555317924,"#E1C1B7"],[0.23037910124458161,"#E1C1B7"],[0.23047445840759573,"#E1C1B7"],[0.23056153396432633,"#E1C1B7"],[0.23064032510285548,"#E1C1B7"],[0.23071082927769504,"#E1C1B7"],[0.23072943114430555,"#E1C1B7"],[0.2307730442101984,"#E1C1B7"],[0.23078445411816395,"#E1C1B7"],[0.2308269678889272,"#E1C1B7"],[0.23087259856997722,"#E1C1B7"],[0.23090993477725907,"#E1C1B7"],[0.23093897530273821,"#E1C1B7"],[0.23095971920662905,"#E1C1B7"],[0.23097216581754754,"#E1C1B7"],[0.23097631473261993,"#E1C1B7"],[0.23118165189150441,"#E1C1B6"],[0.23141934351609139,"#E1C1B6"],[0.23162583388088165,"#E1C0B6"],[0.23204644834049826,"#E1C0B6"],[0.23206196316337657,"#E1C0B6"],[0.23249002601139701,"#E1C0B6"],[0.23266574950552876,"#E1C0B6"],[0.23291000892089131,"#E1C0B6"],[0.23327722810154949,"#E1C0B6"],[0.23332189861339458,"#E1C0B6"],[0.23372568203804756,"#E1C0B6"],[0.23388086539779152,"#E1C0B6"],[0.23412134637358983,"#E1C0B6"],[0.23447664284497982,"#E0C0B6"],[0.23450887903032314,"#E0C0B6"],[0.23488826765204796,"#E0C0B5"],[0.23506454207795402,"#E0C0B5"],[0.23525950011796937,"#E0C0B5"],[0.23562256454457386,"#E0C0B5"],[0.23564454491827547,"#E0C0B5"],[0.23597744928747533,"#E0BFB5"],[0.2362166333768243,"#E0BFB5"],[0.23632414294322968,"#E0BFB5"],[0.23666263435111767,"#E0BFB5"],[0.23678078965638139,"#E0BFB5"],[0.23699291259489597,"#E0BFB5"],[0.23731496700451304,"#E0BFB5"],[0.23733699615419712,"#E0BFB5"],[0.23762878715779401,"#E0BFB5"],[0.23788523546454521,"#E0BFB5"],[0.23793436288208925,"#E0BFB5"],[0.23823168425588825,"#E0BFB5"],[0.23842549038126126,"#E0BFB5"],[0.23852074161039938,"#E0BFB5"],[0.23880152553109124,"#E0BFB4"],[0.23895774390026459,"#E0BFB4"],[0.23907402685919987,"#E0BFB4"],[0.23933823669319643,"#E0BFB4"],[0.23948197922206305,"#E0BFB4"],[0.23959414639021892,"#E0BFB4"],[0.23984174756746457,"#E0BEB4"],[0.23999817975424054,"#E0BEB4"],[0.24008103210354426,"#E0BEB4"],[0.24031199213979604,"#E0BEB4"],[0.24050632911392411,"#E0BEB4"],[0.24053462008156168,"#E0BEB4"],[0.24074890859941933,"#E0BEB4"],[0.24095485063037914,"#E0BEB4"],[0.24100641113023324,"#E0BEB4"],[0.24115243937903486,"#E0BEB4"],[0.24134166831867532,"#E0BEB4"],[0.24146495431027892,"#E0BEB4"],[0.24149840984670812,"#E0BEB4"],[0.24152253119235356,"#E0BEB4"],[0.2416950220139128,"#E0BEB4"],[0.24185913506897161,"#E0BEB4"],[0.24198230952371691,"#E0BEB4"],[0.24201486491586266,"#E0BEB4"],[0.24212563042815083,"#DFBEB4"],[0.2421622063865313,"#DFBEB4"],[0.24230115458738843,"#DFBEB4"],[0.24243170490011856,"#DFBEB3"],[0.24245809464084023,"#DFBEB3"],[0.24255385298244481,"#DFBEB3"],[0.24266759476884869,"#DFBEB3"],[0.24277292647124427,"#DFBEB3"],[0.24277845576171675,"#DFBEB3"],[0.2428698445796067,"#DFBEB3"],[0.24292574989923454,"#DFBEB3"],[0.24295834586255671,"#DFBEB3"],[0.24303842736789749,"#DFBEB3"],[0.24311008642310639,"#DFBEB3"],[0.24317332063578045,"#DFBEB3"],[0.24322812789403503,"#DFBEB3"],[0.24327450636685621,"#DFBEB3"],[0.24331245450440675,"#DFBEB3"],[0.2433419710382847,"#DFBEB3"],[0.24336305498173527,"#DFBEB3"],[0.2433757056298157,"#DFBEB3"],[0.24337992255951324,"#DFBEB3"],[0.24338526022397067,"#DFBEB3"],[0.24342340998841683,"#DFBEB3"],[0.24383661076634822,"#DFBEB3"],[0.24406047296178357,"#DFBDB3"],[0.2442797869061859,"#DFBDB3"],[0.24468962471429567,"#DFBDB3"],[0.24471477425408439,"#DFBDB3"],[0.24514155865366416,"#DFBDB3"],[0.24531084546022341,"#DFBDB3"],[0.2455601261837741,"#DFBDB3"],[0.24592411559846561,"#DFBDB3"],[0.24597046316067428,"#DFBDB3"],[0.24637255614018705,"#DFBDB2"],[0.24652941571537645,"#DFBDB2"],[0.24676639191982075,"#DFBDB2"],[0.24712672658758184,"#DFBDB2"],[0.2471519575408615,"#DFBDB2"],[0.24752924029043444,"#DFBDB2"],[0.24771602918478342,"#DFBDB2"],[0.24789822770353287,"#DFBDB2"],[0.24825890756501467,"#DFBCB2"],[0.24829730467255084,"#DFBCB2"],[0.24861126791156529,"#DFBCB2"],[0.24887053441510099,"#DFBCB2"],[0.24895529703362651,"#DFBCB2"],[0.24929098347729117,"#DFBCB2"],[0.24943569997806159,"#DFBCB2"],[0.24961831604616069,"#DFBCB2"],[0.24993728380316838,"#DEBCB2"],[0.24999278313122153,"#DEBCB2"],[0.25024787607236498,"#DEBCB1"],[0.25054176585126386,"#DEBCB1"],[0.25055008244066557,"#DEBCB1"],[0.25084389275956065,"#DEBCB1"],[0.25108263032448319,"#DEBCB1"],[0.25112929714678622,"#DEBCB1"],[0.25140628598795567,"#DEBCB1"],[0.25161535894948395,"#DEBCB1"],[0.25167484993815137,"#DEBCB1"],[0.25193497992347447,"#DEBCB1"],[0.25213993433986126,"#DEBCB1"],[0.25218666714255566,"#DEBBB1"],[0.25242990306802182,"#DEBBB1"],[0.25265633932686204,"#DEBBB1"],[0.25266467944792148,"#DEBBB1"],[0.25289098830710743,"#DEBBB1"],[0.25310882194857487,"#DEBBB1"],[0.25316455696202533,"#DEBBB1"],[0.25331817295475667,"#DEBBB1"],[0.25342446762161219,"#DEBBB1"],[0.2535190341887732,"#DEBBB1"],[0.25366457051980196,"#DEBBB1"],[0.25371139879563787,"#DEBBB1"],[0.25389526020341691,"#DEBBB0"],[0.25407061212434268,"#DEBBB0"],[0.25409573666555985,"#DEBBB0"],[0.25415636350015192,"#DEBBB0"],[0.25423744855588215,"#DEBBB0"],[0.25439576378175621,"#DEBBB0"],[0.25454555237291465,"#DEBBB0"],[0.25463991963111843,"#DEBBB0"],[0.25468680918846121,"#DEBBB0"],[0.25475904764621504,"#DEBBB0"],[0.25481952937653174,"#DEBBB0"],[0.25494370837512381,"#DEBBB0"],[0.2550593419128786,"#DEBBB0"],[0.25511522287137878,"#DEBBB0"],[0.25516642600981232,"#DEBBB0"],[0.255264956977999,"#DEBBB0"],[0.255354931422205,"#DEBBB0"],[0.25541437929535504,"#DEBBB0"],[0.25543634624047196,"#DEBBB0"],[0.25550919862465049,"#DEBBB0"],[0.2555734860608847,"#DEBBB0"],[0.25558225741276963,"#DEBBB0"],[0.25562920633004427,"#DEBBB0"],[0.25567635750810791,"#DEBBB0"],[0.25571493796649514,"#DEBBB0"],[0.25574494637234702,"#DEBBB0"],[0.25576638168875687,"#DEBBB0"],[0.25577924317494882,"#DEBBB0"],[0.25578353038640633,"#DEBBB0"],[0.25604100768278726,"#DEBBB0"],[0.25606171052611615,"#DEBBB0"],[0.25649145834706166,"#DEBAB0"],[0.25670102043605814,"#DEBAB0"],[0.25693359431180174,"#DEBAB0"],[0.25733228831022359,"#DEBAB0"],[0.25736740072621433,"#DEBAB0"],[0.25779286298489279,"#DDBAAF"],[0.25795549362418824,"#DDBAAF"],[0.25820996673017538,"#DDBAAF"],[0.2585706160470993,"#DDBAAF"],[0.25861869785447456,"#DDBAAF"],[0.25901904250257246,"#DDBAAF"],[0.25917763544470684,"#DDBAAF"],[0.25941098707388577,"#DDBAAF"],[0.25977653188238103,"#DDBAAF"],[0.25979451822469579,"#DDBAAF"],[0.26016962287034584,"#DDBAAF"],[0.26036728562811817,"#DDBAAF"],[0.26053628818740238,"#DDB9AF"],[0.26089450161578087,"#DDB9AF"],[0.26094987715553286,"#DDB9AF"],[0.26124425086083602,"#DDB9AF"],[0.26152428714683618,"#DDB9AF"],[0.26158552389541267,"#DDB9AE"],[0.26191830896186086,"#DDB9AE"],[0.26209049649579863,"#DDB9AE"],[0.26224259457401033,"#DDB9AE"],[0.26255836951910605,"#DDB9AE"],[0.26264848631069615,"#DDB9AE"],[0.26286562285970361,"#DDB9AE"],[0.26316434393552302,"#DDB9AE"],[0.26319823791723951,"#DDB9AE"],[0.2634545223652609,"#DDB9AE"],[0.26373614804836043,"#DDB9AE"],[0.26373973286148611,"#DDB9AE"],[0.2640092111667377,"#DDB9AE"],[0.26427295291273067,"#DDB9AE"],[0.26427370218646407,"#DDB9AE"],[0.26452961185940449,"#DDB9AE"],[0.26477693122481083,"#DDB8AE"],[0.26479788006637772,"#DDB8AE"],[0.26501565161086782,"#DDB8AE"],[0.26524576463619476,"#DCB8AE"],[0.26531449654679184,"#DCB8AE"],[0.26536925293935165,"#DCB8AD"],[0.26546726221129868,"#DCB8AD"],[0.26568013653998024,"#DCB8AD"],[0.26582278481012667,"#DCB8AD"],[0.26588438012069149,"#DCB8AD"],[0.26605144659771518,"#DCB8AD"],[0.26607998574784542,"#DCB8AD"],[0.26626694651307525,"#DCB8AD"],[0.26632272754712949,"#DCB8AD"],[0.26644525580644485,"#DCB8AD"],[0.26661490731760851,"#DCB8AD"],[0.26672557248599671,"#DCB8AD"],[0.26677589503691979,"#DCB8AD"],[0.26681430768592362,"#DCB8AD"],[0.26692821325648997,"#DCB8AD"],[0.26707185657119381,"#DCB8AD"],[0.26720681987962447,"#DCB8AD"],[0.26729750839476352,"#DCB8AD"],[0.26733309838499464,"#DCB8AD"],[0.26739160833298248,"#DCB8AD"],[0.26745068759598667,"#DCB8AD"],[0.26755958332754759,"#DCB8AD"],[0.26765978170163229,"#DCB8AD"],[0.2677512791478921,"#DCB8AD"],[0.2677723130847659,"#DCB8AD"],[0.26783407240430956,"#DCB8AD"],[0.26790815851777905,"#DCB8AD"],[0.26797353484463204,"#DCB8AD"],[0.26803019905110903,"#DCB8AD"],[0.26804953205415527,"#DCB8AD"],[0.26807814911377503,"#DCB8AD"],[0.26811738331988133,"#DCB8AD"],[0.2681479002676701,"#DCB8AD"],[0.26816969886662623,"#DCB8AD"],[0.26818277833767024,"#DCB8AD"],[0.26818713821329954,"#DCB8AD"],[0.26823870541261308,"#DCB8AD"],[0.26869666928322744,"#DCB7AD"],[0.26869932175499089,"#DCB7AD"],[0.26914618885241903,"#DCB7AD"],[0.26934095573424832,"#DCB7AC"],[0.26958724852950089,"#DCB7AC"],[0.26997441248725051,"#DCB7AC"],[0.27001983297987608,"#DCB7AC"],[0.2704439271275898,"#DCB7AC"],[0.27059967070915658,"#DCB7AC"],[0.27085951615785253,"#DCB7AC"],[0.2712167092982245,"#DCB7AC"],[0.27126658551952598,"#DCB7AC"],[0.27166512092757622,"#DCB7AC"],[0.2718255073590613,"#DCB7AC"],[0.27205510836549163,"#DCB7AC"],[0.27242604420586181,"#DCB7AC"],[0.27243653408766311,"#DCB7AC"],[0.27280938462172755,"#DCB7AC"],[0.27301829936563404,"#DBB6AC"],[0.27317364677087363,"#DBB6AB"],[0.27352930761610661,"#DBB6AB"],[0.27360225258141013,"#DBB6AB"],[0.27387635451847592,"#DBB6AB"],[0.27417788381544206,"#DBB6AB"],[0.2742147751212588,"#DBB6AB"],[0.27454455735210448,"#DBB6AB"],[0.27474517325237979,"#DBB6AB"],[0.27486568942513467,"#DBB6AB"],[0.27517815984300076,"#DBB6AB"],[0.27530410130243343,"#DBB6AB"],[0.27548195739889669,"#DBB6AB"],[0.27577707117852734,"#DBB6AB"],[0.27585464860451625,"#DBB6AB"],[0.27606349056203028,"#DBB6AB"],[0.27634120522585115,"#DBB6AB"],[0.27639679602936673,"#DBB6AB"],[0.27661020514457224,"#DBB6AB"],[0.27687048059269204,"#DBB6AB"],[0.27693052468265178,"#DBB6AA"],[0.27712202214635662,"#DBB5AA"],[0.27729857999174667,"#DBB5AA"],[0.27736482068504076,"#DBB5AA"],[0.27745581590804658,"#DBB5AA"],[0.27759886739318029,"#DBB5AA"],[0.27782415376175107,"#DBB5AA"],[0.27797265129029181,"#DBB5AA"],[0.27799204506019026,"#DBB5AA"],[0.27804067158979928,"#DBB5AA"],[0.27824841298591707,"#DBB5AA"],[0.27844737036966682,"#DBB5AA"],[0.27848101265822778,"#DBB5AA"],[0.27863753647295142,"#DBB5AA"],[0.2786773301766754,"#DBB5AA"],[0.27881890434133116,"#DBB5AA"],[0.27898088208780181,"#DBB5AA"],[0.27899146733528457,"#DBB5AA"],[0.27915521913141661,"#DBB5AA"],[0.2793101537236089,"#DBB5AA"],[0.27935441200546185,"#DBB5AA"],[0.2794562654241155,"#DBB5AA"],[0.27947224190505016,"#DBB5AA"],[0.27959354886460164,"#DBB5AA"],[0.2797219989971248,"#DBB5AA"],[0.27984161109506001,"#DBB5AA"],[0.27995238075396589,"#DBB5AA"],[0.27995507468905323,"#DBB5AA"],[0.28002326740289674,"#DBB5AA"],[0.28005430389239294,"#DBB5AA"],[0.28014737675263401,"#DBB5AA"],[0.28023159590141511,"#DBB5AA"],[0.28030695823052765,"#DBB5AA"],[0.28037346095740101,"#DBB5AA"],[0.28042936327486145,"#DBB5AA"],[0.28043110162561558,"#DBB5AA"],[0.28047987810535613,"#DAB5AA"],[0.28051978859380466,"#DAB5AA"],[0.28055083161547401,"#DAB5AA"],[0.28057300602248003,"#DAB5AA"],[0.28058631099475362,"#DAB5AA"],[0.28059074604019285,"#DAB5AA"],[0.28068387342096257,"#DAB5AA"],[0.28089509075639174,"#DAB5A9"],[0.28133620731081677,"#DAB4A9"],[0.28135224048929441,"#DAB4A9"],[0.28180079609378716,"#DAB4A9"],[0.28198024652632669,"#DAB4A9"],[0.28224074145745703,"#DAB4A9"],[0.28261596872759265,"#DAB4A9"],[0.28267206073802875,"#DAB4A9"],[0.28309473836609789,"#DAB4A9"],[0.28324335178446503,"#DAB4A9"],[0.28350875904782802,"#DAB4A9"],[0.28386237378004775,"#DAB4A9"],[0.28391410776761195,"#DAB4A9"],[0.28431076979069403,"#DAB4A9"],[0.28447301301419092,"#DAB4A9"],[0.28469873066575291,"#DAB4A8"],[0.28507524800697071,"#DAB4A8"],[0.28507797622744657,"#DAB4A8"],[0.28544849259891436,"#DAB3A8"],[0.28566905750215399,"#DAB3A8"],[0.28581026619423722,"#DAB3A8"],[0.28616328372085609,"#DAB3A8"],[0.28625442047064864,"#DAB3A8"],[0.28650753218194525,"#DAB3A8"],[0.28683131611393631,"#DAB3A8"],[0.28684299887874132,"#DAB3A8"],[0.28716967141282623,"#DAB3A8"],[0.28739972386748747,"#DAB3A8"],[0.28748753768836321,"#DAB3A8"],[0.28779658591428592,"#DAB3A8"],[0.28795962340415815,"#DAB3A8"],[0.2880968046064375,"#D9B3A8"],[0.28838818258966181,"#D9B3A8"],[0.28851099463756613,"#D9B3A7"],[0.2886707089998426,"#D9B3A7"],[0.28894437328589351,"#D9B3A7"],[0.28905381772544503,"#D9B3A7"],[0.28920916521169382,"#D9B3A7"],[0.28921167045930485,"#D9B3A7"],[0.28946507485797335,"#D9B2A7"],[0.28958807307297674,"#D9B2A7"],[0.28971209262414144,"#D9B2A7"],[0.2899167697194418,"#D9B2A7"],[0.28995020923006465,"#D9B2A7"],[0.29011374133609957,"#D9B2A7"],[0.29017941571778583,"#D9B2A7"],[0.29039970345318977,"#D9B2A7"],[0.29061106412761106,"#D9B2A7"],[0.29061357432612578,"#D9B2A7"],[0.29063080342479208,"#D9B2A7"],[0.29081348975938515,"#D9B2A7"],[0.2910069726953407,"#D9B2A7"],[0.291139240506329,"#D9B2A7"],[0.2911915056122345,"#D9B2A7"],[0.29130205981299773,"#D9B2A7"],[0.29136708151812563,"#D9B2A7"],[0.29153369375369098,"#D9B2A7"],[0.29163903400851188,"#D9B2A7"],[0.29169133599348007,"#D9B2A7"],[0.29184000224710827,"#D9B2A7"],[0.29197968686038955,"#D9B2A7"],[0.29198220191120405,"#D9B2A7"],[0.29211038451640592,"#D9B2A7"],[0.2921301656228692,"#D9B2A7"],[0.29223209023651564,"#D9B2A7"],[0.29234479938129843,"#D9B2A6"],[0.29244850765143615,"#D9B2A6"],[0.29254321108853076,"#D9B2A6"],[0.29261261730782839,"#D9B2A6"],[0.29262890607585845,"#D9B2A6"],[0.29265397655321757,"#D9B2A6"],[0.29270558933905866,"#D9B2A6"],[0.29277325794675846,"#D9B2A6"],[0.29283190931113268,"#D9B2A6"],[0.29288154118839727,"#D9B2A6"],[0.29292215167923941,"#D9B2A6"],[0.29295373922917967,"#D9B2A6"],[0.29297630262886976,"#D9B2A6"],[0.29298984101432446,"#D9B2A6"],[0.29299435386708605,"#D9B2A6"],[0.29308637129185455,"#D9B2A6"],[0.29331735987665053,"#D9B2A6"],[0.29355141007656016,"#D9B1A6"],[0.29397232822806374,"#D9B1A6"],[0.29400771643977763,"#D9B1A6"],[0.29445527343860012,"#D9B1A6"],[0.29461885816676636,"#D9B1A6"],[0.29489406441238508,"#D9B1A6"],[0.29525692646860702,"#D9B1A6"],[0.29532407298572105,"#D9B1A6"],[0.29574528307135717,"#D8B1A6"],[0.29588651012975598,"#D8B1A6"],[0.29615767887309119,"#D8B1A6"],[0.29650758637047381,"#D8B1A5"],[0.29656124488861957,"#D8B1A5"],[0.2969559659123443,"#D8B1A5"],[0.29712013263886938,"#D8B1A5"],[0.29734182703813727,"#D8B1A5"],[0.29771881366206077,"#D8B0A5"],[0.29772412661464209,"#D8B0A5"],[0.29808691148504296,"#D8B0A5"],[0.29831954621281087,"#D8B0A5"],[0.29844610651550751,"#D8B0A5"],[0.29879638507195538,"#D8B0A5"],[0.29890636958742356,"#D8B0A5"],[0.29913773378549857,"#D8B0A5"],[0.29947013960234514,"#D8B0A5"],[0.29948457513525129,"#D8B0A5"],[0.29979358978623227,"#D8B0A5"],[0.30005414149946252,"#D8B0A4"],[0.30010807192080957,"#D8B0A4"],[0.30041357391196888,"#D8B0A4"],[0.30061504757327551,"#D8B0A4"],[0.30071008399012067,"#D8B0A4"],[0.30099759071241661,"#D8B0A4"],[0.30110769405093263,"#D8B0A4"],[0.30116727250359054,"#D8B0A4"],[0.30127608296491637,"#D8B0A4"],[0.30154554996469762,"#D8B0A4"],[0.30171079569459713,"#D8B0A4"],[0.3018059812619095,"#D8B0A4"],[0.30182480720865956,"#D8B0A4"],[0.30205736674176742,"#D8AFA4"],[0.30224559681135932,"#D8AFA4"],[0.30229969662648959,"#D8AFA4"],[0.30253296147717246,"#D8AFA4"],[0.30253350845083038,"#D8AFA4"],[0.3027571521956065,"#D8AFA4"],[0.30277165578337106,"#D8AFA4"],[0.30297226002603039,"#D8AFA4"],[0.30317827655682172,"#D7AFA4"],[0.30323377210943059,"#D7AFA4"],[0.30328895280808832,"#D7AFA4"],[0.3033751937221264,"#D7AFA4"],[0.30356300380342327,"#D7AFA4"],[0.30374169943102403,"#D7AFA4"],[0.30379746835443044,"#D7AFA4"],[0.30391127358550862,"#D7AFA3"],[0.30392557271936804,"#D7AFA3"],[0.30407171959909496,"#D7AFA3"],[0.30422303115694105,"#D7AFA3"],[0.30429718316625121,"#D7AFA3"],[0.30436520229838149,"#D7AFA3"],[0.30449822741809607,"#D7AFA3"],[0.30460888502258754,"#D7AFA3"],[0.30462210126720946,"#D7AFA3"],[0.3047368189543227,"#D7AFA3"],[0.30478807826578014,"#D7AFA3"],[0.3048423759464769,"#D7AFA3"],[0.30493876807004494,"#D7AFA3"],[0.30502599151155574,"#D7AFA3"],[0.30510404281844616,"#D7AFA3"],[0.30517291889974407,"#D7AFA3"],[0.3052326170266787,"#D7AFA3"],[0.30527013495702959,"#D7AFA3"],[0.30528313483322156,"#D7AFA3"],[0.30528368397218397,"#D7AFA3"],[0.30532447031655419,"#D7AFA3"],[0.30535662183746515,"#D7AFA3"],[0.30537958812067501,"#D7AFA3"],[0.30539336825508934,"#D7AFA3"],[0.30539796169397915,"#D7AFA3"],[0.30574333482916949,"#D7AFA3"],[0.30594994473650983,"#D7AFA3"],[0.30620765975986475,"#D7AEA3"],[0.30660764270327479,"#D7AEA3"],[0.30666309191857755,"#D7AEA3"],[0.30710961376983159,"#D7AEA3"],[0.30725675348363923,"#D7AEA3"],[0.30754720807643543,"#D7AEA3"],[0.30789725291629766,"#D7AEA2"],[0.30797585790266746,"#D7AEA2"],[0.30839554661741742,"#D7AEA2"],[0.30852911707155062,"#D7AEA2"],[0.30880625789728477,"#D7AEA2"],[0.30915232225536615,"#D7AEA2"],[0.30920797572963332,"#D7AEA2"],[0.30960068441559918,"#D7AEA2"],[0.309766845013426,"#D7AEA2"],[0.30998436857305212,"#D7AEA2"],[0.31035901313950887,"#D7ADA2"],[0.31037266213515824,"#D7ADA2"],[0.31072460337499586,"#D6ADA2"],[0.3109697506577529,"#D6ADA2"],[0.31108112486486217,"#D6ADA2"],[0.31142856352254,"#D6ADA2"],[0.3115580878701586,"#D6ADA2"],[0.31176690559225217,"#D6ADA1"],[0.31209613765166477,"#D6ADA1"],[0.31213765131706228,"#D6ADA1"],[0.31241624661448486,"#D6ADA1"],[0.31270841880284572,"#D6ADA1"],[0.3127272197330011,"#D6ADA1"],[0.31298576419945667,"#D6ADA1"],[0.31302904460056657,"#D6ADA1"],[0.31327036839552069,"#D6ADA1"],[0.3133217091540228,"#D6ADA1"],[0.3136052016760642,"#D6ADA1"],[0.31371528888731237,"#D6ADA1"],[0.31382347843064073,"#D6ADA1"],[0.31387951079754006,"#D6ADA1"],[0.31414462549969668,"#D6ADA1"],[0.31436772751518682,"#D6ACA1"],[0.31440053511635391,"#D6ACA1"],[0.31443628180036554,"#D6ACA1"],[0.31464722933601952,"#D6ACA1"],[0.31488469820393772,"#D6ACA1"],[0.31490309453142695,"#D6ACA1"],[0.31511293212407154,"#D6ACA1"],[0.31514871599255023,"#D6ACA1"],[0.31533192186101888,"#D6ACA1"],[0.31542955864074662,"#D6ACA1"],[0.31554165854186023,"#D6ACA1"],[0.31574213365793813,"#D6ACA0"],[0.31585256472609669,"#D6ACA0"],[0.31593333906656673,"#D6ACA0"],[0.31594709928745046,"#D6ACA0"],[0.31611526699267178,"#D6ACA0"],[0.31628791003035883,"#D6ACA0"],[0.31645126114441047,"#D6ACA0"],[0.31645569620253178,"#D6ACA0"],[0.31654780147597095,"#D6ACA0"],[0.31660531367171041,"#D6ACA0"],[0.31675006132259487,"#D6ACA0"],[0.31688549818213008,"#D6ACA0"],[0.31695532940740989,"#D6ACA0"],[0.31701161871131556,"#D6ACA0"],[0.3171284177482121,"#D6ACA0"],[0.31723439993431113,"#D6ACA0"],[0.31723589050899459,"#D6ACA0"],[0.31733403258892934,"#D6ACA0"],[0.31742283996327392,"#D6ACA0"],[0.3174459792176324,"#D6ACA0"],[0.31750230898810061,"#D6ACA0"],[0.31757243640104349,"#D6ACA0"],[0.31763321932196631,"#D6ACA0"],[0.31768465525355361,"#D6ACA0"],[0.31772674208182383,"#D6ACA0"],[0.31775947807656235,"#D6ACA0"],[0.31778286189167804,"#D6ACA0"],[0.31779689256547938,"#D6ACA0"],[0.31780156952087246,"#D6ACA0"],[0.31791233401486163,"#D6ACA0"],[0.31792762624654292,"#D6ACA0"],[0.31840025140891037,"#D5ACA0"],[0.31858157785740104,"#D5ABA0"],[0.31886383592451961,"#D5ABA0"],[0.31924210583216373,"#D5ABA0"],[0.31931836132172275,"#D5ABA0"],[0.31976380944094696,"#D5AB9F"],[0.31989389254425382,"#D5AB9F"],[0.32020016243816152,"#D5AB9F"],[0.32053691283804886,"#D5AB9F"],[0.32062740278829782,"#D5AB9F"],[0.32104551328862418,"#D5AB9F"],[0.32117114180159267,"#D5AB9F"],[0.32145447706207375,"#D5AB9F"],[0.32179655477097457,"#D5AB9F"],[0.32185427756052165,"#D5AB9F"],[0.32224489856801342,"#D5AB9F"],[0.32241312733469496,"#D5AB9F"],[0.32262632420394055,"#D5AB9F"],[0.32299853892616315,"#D5AA9F"],[0.32302083533801496,"#D5AA9F"],[0.32336152753407787,"#D5AA9E"],[0.3236196548872875,"#D5AA9E"],[0.32371527517162879,"#D5AA9E"],[0.32405976733026398,"#D5AA9E"],[0.32420956235427012,"#D5AA9E"],[0.32439498985182902,"#D5AA9E"],[0.32472092893140414,"#D5AA9E"],[0.32479053438041583,"#D5AA9E"],[0.32484493333408859,"#D5AA9E"],[0.32503757112007836,"#D5AA9E"],[0.32534490332766097,"#D5AA9E"],[0.32536254788114249,"#D5AA9E"],[0.32558728618221344,"#D4AA9E"],[0.3256429128253302,"#D4AA9E"],[0.32592558005007688,"#D4AA9E"],[0.32593158724821603,"#D4AA9E"],[0.32621091459791685,"#D4AA9E"],[0.32632098476815052,"#D4AA9E"],[0.32647960836327383,"#D4AA9E"],[0.32648088324494884,"#D4AA9E"],[0.32674148193112718,"#D4AA9E"],[0.3269926997718765,"#D4A99E"],[0.32702461058340715,"#D4A99E"],[0.32704600078556689,"#D4A99E"],[0.32723452625847205,"#D4A99D"],[0.32746695126020786,"#D4A99D"],[0.32756056476393147,"#D4A99D"],[0.32768996502649239,"#D4A99D"],[0.3277623061417142,"#D4A99D"],[0.32790355818887096,"#D4A99D"],[0.32808744925321343,"#D4A99D"],[0.32810772176297198,"#D4A99D"],[0.32830244715037882,"#D4A99D"],[0.32846987296222119,"#D4A99D"],[0.32848772614042454,"#D4A99D"],[0.32860524269863012,"#D4A99D"],[0.32866355091190846,"#D4A99D"],[0.32882991403473605,"#D4A99D"],[0.3289868084714771,"#D4A99D"],[0.329113924050633,"#D4A99D"],[0.32913422757884669,"#D4A99D"],[0.3291686735958832,"#D4A99D"],[0.32927216510910373,"#D4A99D"],[0.3294006152113691,"#D4A99D"],[0.32951957243286112,"#D4A99D"],[0.3296134725667762,"#D4A99D"],[0.32962903172004954,"#D4A99D"],[0.32972898841972453,"#D4A99D"],[0.32981943827998461,"#D4A99D"],[0.32985868061945312,"#D4A99D"],[0.32990037745113832,"#D4A99D"],[0.32997180248652169,"#D4A99D"],[0.3300337103432317,"#D4A99D"],[0.3300860983827737,"#D4A99D"],[0.33010386781570733,"#D4A99D"],[0.33012896437162231,"#D4A99D"],[0.33016230648169886,"#D4A99D"],[0.33018612329075914,"#D4A99D"],[0.33020041378269804,"#D4A99D"],[0.33020517734776578,"#D4A99D"],[0.33053986684242664,"#D4A99D"],[0.33058508968111833,"#D4A99D"],[0.33105711836565632,"#D4A89D"],[0.33121220531182405,"#D4A89C"],[0.33151993439479088,"#D4A89C"],[0.33187566931696499,"#D4A89C"],[0.33197351862063718,"#D4A89C"],[0.33241785222573417,"#D4A89C"],[0.33253023239423374,"#D4A89C"],[0.33285291672677331,"#D4A89C"],[0.33317586833183677,"#D3A89C"],[0.33327869397828036,"#D3A89C"],[0.33369516617624362,"#D3A89C"],[0.33381255117454633,"#D3A89C"],[0.33410231586169203,"#D3A89C"],[0.33444025522843179,"#D3A89C"],[0.33450012592421763,"#D3A89C"],[0.33488857960544327,"#D3A89C"],[0.33505895506557448,"#D3A89B"],[0.33526766050243229,"#D3A79B"],[0.33563735257104022,"#D3A79B"],[0.3356686255287662,"#D3A79B"],[0.33599764012920441,"#D3A79B"],[0.33626924173618877,"#D3A79B"],[0.33634850786017467,"#D3A79B"],[0.3366841876821085,"#D3A79B"],[0.33668994081567694,"#D3A79B"],[0.33686077908607237,"#D3A79B"],[0.33702192441901557,"#D3A79B"],[0.33734444446810585,"#D3A79B"],[0.33743980546265484,"#D3A79B"],[0.33744321326133087,"#D3A79B"],[0.33765748713844201,"#D3A79B"],[0.33796103898599361,"#D3A79B"],[0.33801652023417394,"#D3A79B"],[0.33818664384129615,"#D3A79B"],[0.33825508695003237,"#D3A79B"],[0.33853961835588708,"#D3A79B"],[0.33858067627069177,"#D3A79B"],[0.33881462091762504,"#D3A79B"],[0.33892467306290097,"#D3A79B"],[0.33908008274065871,"#D3A79A"],[0.33913565793541156,"#D3A79A"],[0.33933599232427736,"#D3A79A"],[0.33958233856410058,"#D3A69A"],[0.33965386359107141,"#D3A69A"],[0.33968144209582496,"#D3A69A"],[0.33981911075445426,"#D3A69A"],[0.34004629859066726,"#D3A69A"],[0.34021800592688212,"#D3A69A"],[0.34026389217128628,"#D3A69A"],[0.34037418611331738,"#D3A69A"],[0.34047188200021095,"#D2A69A"],[0.34067025898874437,"#D2A69A"],[0.34074532691545378,"#D2A69A"],[0.34085901445756139,"#D2A69A"],[0.3410381401385908,"#D2A69A"],[0.3410856115462344,"#D2A69A"],[0.34120762817681338,"#D2A69A"],[0.34126338286475499,"#D2A69A"],[0.34136747113197186,"#D2A69A"],[0.34151766198019362,"#D2A69A"],[0.34165819411552689,"#D2A69A"],[0.34177215189873411,"#D2A69A"],[0.3417881110406823,"#D2A69A"],[0.34178906135138554,"#D2A69A"],[0.34191025792190533,"#D2A69A"],[0.3420217784832098,"#D2A69A"],[0.34212361811458403,"#D2A69A"],[0.34221577231955835,"#D2A69A"],[0.3422716124664209,"#D2A69A"],[0.34229823702689777,"#D2A69A"],[0.34237100859150027,"#D2A69A"],[0.34243408379520113,"#D2A69A"],[0.34248165598696112,"#D2A69A"],[0.34248745984748352,"#D2A69A"],[0.34253113438609506,"#D2A69A"],[0.34256510547757102,"#D2A69A"],[0.3425893716176609,"#D2A69A"],[0.34260393173166248,"#D2A69A"],[0.34260878517465898,"#D2A69A"],[0.34276174334623311,"#D2A69A"],[0.34316621801998737,"#D2A699"],[0.34324252365023966,"#D2A699"],[0.34371393282838059,"#D2A599"],[0.34384176902446262,"#D2A599"],[0.34417595067263751,"#D2A599"],[0.34450828114003706,"#D2A599"],[0.34462855732115671,"#D2A599"],[0.3450717332623211,"#D2A599"],[0.34516572676646418,"#D2A599"],[0.3455054593387703,"#D2A599"],[0.34581407856874546,"#D2A599"],[0.34592971675136452,"#D2A599"],[0.34634448706309495,"#D2A599"],[0.34645330948226194,"#D2A599"],[0.34674975220293347,"#D2A599"],[0.34708339271789179,"#D2A598"],[0.34714549446962428,"#D2A598"],[0.34753169653541327,"#D2A598"],[0.34770430176711131,"#D2A598"],[0.34790834144971394,"#D1A498"],[0.34827541264270834,"#D1A498"],[0.3483160104070786,"#D1A498"],[0.34850244154602983,"#D1A498"],[0.34863289392888186,"#D1A498"],[0.34891849270569519,"#D1A498"],[0.34898076951048773,"#D1A498"],[0.34927178239613366,"#D1A498"],[0.34931902398094328,"#D1A498"],[0.34951172302664557,"#D1A498"],[0.34964764232815315,"#D1A498"],[0.34996660993775897,"#D1A498"],[0.35003221603637347,"#D1A498"],[0.35009567603441427,"#D1A498"],[0.35027591259631474,"#D1A498"],[0.350575536494385,"#D1A498"],[0.35067032669927323,"#D1A498"],[0.35078371116743201,"#D1A497"],[0.35086546822956488,"#D1A497"],[0.35114569480941982,"#D1A497"],[0.35123565030224224,"#D1A497"],[0.35141620365434567,"#D1A497"],[0.35152623671366678,"#D1A497"],[0.35167698260034452,"#D1A497"],[0.35179162244001927,"#D1A497"],[0.35192801990171729,"#D1A497"],[0.35216930423367099,"#D1A397"],[0.35225976182870311,"#D1A397"],[0.35233821902987605,"#D1A397"],[0.35240082469483858,"#D1A397"],[0.3526225708097116,"#D1A397"],[0.35283453253098374,"#D1A397"],[0.35287541631452057,"#D1A397"],[0.35298425590103311,"#D1A397"],[0.35303670024180189,"#D1A397"],[0.35322906475792837,"#D1A397"],[0.35340319086692096,"#D1A397"],[0.35341161732980841,"#D1A397"],[0.35358434964454466,"#D1A397"],[0.3536996885596192,"#D1A397"],[0.35374725382777628,"#D1A397"],[0.35390032244546266,"#D1A397"],[0.35392151959509122,"#D1A397"],[0.35404354850557007,"#D1A397"],[0.35417692545966073,"#D1A397"],[0.35430044720438303,"#D1A397"],[0.35440602967949819,"#D1A397"],[0.35441410808286344,"#D1A397"],[0.35443037974683544,"#D1A397"],[0.35451790288599616,"#D1A397"],[0.35461182685363546,"#D1A397"],[0.35469587567568317,"#D1A396"],[0.354770045493076,"#D1A396"],[0.35483433289867083,"#D1A396"],[0.35488873493802542,"#D1A396"],[0.35492974891444884,"#D1A396"],[0.35493324911007729,"#D1A396"],[0.35496787336771818,"#D1A396"],[0.35499260611826422,"#D1A396"],[0.35500744622382241,"#D1A396"],[0.35501239300155218,"#D1A396"],[0.35510324938738702,"#D1A396"],[0.35541960503937198,"#D0A396"],[0.35579131806728448,"#D0A396"],[0.35589992641679946,"#D0A396"],[0.35637069170023661,"#D0A296"],[0.35647020636606985,"#D0A296"],[0.35683187990600662,"#D0A296"],[0.35713988519909479,"#D0A296"],[0.3572834704177017,"#D0A296"],[0.35772544299057973,"#D0A296"],[0.35780032575576659,"#D0A296"],[0.35815777775590107,"#D0A296"],[0.35845149950512079,"#D0A296"],[0.35858045522520787,"#D0A295"],[0.35899345629453838,"#D0A295"],[0.35909337820138032,"#D0A295"],[0.35939676224857831,"#D0A295"],[0.35972593388950092,"#D0A295"],[0.35979035476474652,"#D0A295"],[0.36017421591721066,"#D0A295"],[0.36029853099569087,"#D0A295"],[0.36034913891069698,"#D0A195"],[0.36054832818083493,"#D0A195"],[0.36091267443505326,"#D0A195"],[0.36096296590794985,"#D0A195"],[0.36108207572436068,"#D0A195"],[0.36126723796766957,"#D0A195"],[0.36156738783149289,"#D0A195"],[0.36161200247858261,"#D0A195"],[0.3618565827610738,"#D0A195"],[0.36194695208343142,"#D0A195"],[0.36216237794427253,"#D0A195"],[0.3622720713171621,"#D0A195"],[0.36258734513751245,"#CFA194"],[0.36262201915949521,"#CFA194"],[0.36274790982738336,"#CFA194"],[0.36289275892841333,"#CFA194"],[0.36318829850330547,"#CFA194"],[0.36332395738547341,"#CFA194"],[0.36337835220161885,"#CFA194"],[0.36347395010836858,"#CFA194"],[0.36374970042566246,"#CFA194"],[0.36389049485211855,"#CFA194"],[0.3640155365761778,"#CFA194"],[0.36412554940381892,"#CFA194"],[0.36427144612279527,"#CFA194"],[0.36444749679516419,"#CFA194"],[0.36451741707315133,"#CFA194"],[0.36475343788240899,"#CFA094"],[0.36486357852290785,"#CFA094"],[0.36497949745593261,"#CFA094"],[0.36499493812202954,"#CFA094"],[0.36519558515186479,"#CFA094"],[0.36540169078360352,"#CFA094"],[0.3655327940849743,"#CFA094"],[0.36559240756220457,"#CFA094"],[0.3655978046221805,"#CFA094"],[0.36578391739853588,"#CFA094"],[0.36596002030569141,"#CFA094"],[0.36606104028632513,"#CFA094"],[0.36612610500081821,"#CFA094"],[0.36628216360720112,"#CFA094"],[0.36631200477760695,"#CFA094"],[0.36642818871609439,"#CFA094"],[0.36656417338847203,"#CFA093"],[0.36657965268365822,"#CFA093"],[0.36669011115666861,"#CFA093"],[0.36680599602591157,"#CFA093"],[0.36691182247574283,"#CFA093"],[0.3670075854613305,"#CFA093"],[0.36702233868366763,"#CFA093"],[0.36708860759493678,"#CFA093"],[0.3670932804146676,"#CFA093"],[0.36716890324566043,"#CFA093"],[0.36723445034310198,"#CFA093"],[0.36728991857553406,"#CFA093"],[0.36733530529199387,"#CFA093"],[0.36737060832264745,"#CFA093"],[0.36739582597930831,"#CFA093"],[0.36741095705583993,"#CFA093"],[0.3674160008284455,"#CFA093"],[0.36758788170360057,"#CFA093"],[0.36772337805967137,"#CFA093"],[0.36807745206360576,"#CFA093"],[0.3684150919557091,"#CFA093"],[0.36855729610441146,"#CFA093"],[0.36902739163591147,"#CF9F93"],[0.36909744969875125,"#CF9F93"],[0.36948771685330883,"#CF9F93"],[0.36977042089871237,"#CE9F93"],[0.36993825034193106,"#CE9F93"],[0.37037897108198226,"#CE9F93"],[0.37043397545450829,"#CE9F92"],[0.37080985845323222,"#CE9F92"],[0.37108808356010181,"#CE9F92"],[0.3712308922396379,"#CE9F92"],[0.37164205263389527,"#CE9F92"],[0.37173271571053579,"#CE9F92"],[0.3720433202419221,"#CE9F92"],[0.37207120690694206,"#CE9F92"],[0.3723678427079492,"#CE9F92"],[0.37243467608726488,"#CE9F92"],[0.37281610161543122,"#CE9F92"],[0.37286946039143898,"#CE9F92"],[0.37299343566757559,"#CE9E92"],[0.37318757869814323,"#CE9E92"],[0.37354908963751221,"#CE9E92"],[0.37360946602371925,"#CE9E92"],[0.37365854303390744,"#CE9E92"],[0.37390061717012912,"#CE9E92"],[0.37421590553570983,"#CE9E92"],[0.37424214447107185,"#CE9E92"],[0.37443842013007833,"#CE9E91"],[0.37457365515782548,"#CE9E91"],[0.37481272629382856,"#CE9E91"],[0.37489513329411306,"#CE9E91"],[0.37520656339363734,"#CE9E91"],[0.37520905720828557,"#CE9E91"],[0.37539990072520701,"#CE9E91"],[0.3755079304237281,"#CE9E91"],[0.37579921980889541,"#CE9E91"],[0.37597042003601422,"#CE9E91"],[0.37597740159969428,"#CE9E91"],[0.37608041743428644,"#CE9E91"],[0.37635150964904351,"#CE9E91"],[0.37654520203568931,"#CE9E91"],[0.37661248326956209,"#CE9E91"],[0.37672247462646313,"#CE9E91"],[0.37686332558264624,"#CE9E91"],[0.37710327550593759,"#CD9E91"],[0.37710402434856083,"#CD9E91"],[0.37733456780397723,"#CD9D91"],[0.37746518724512013,"#CD9D91"],[0.37755494466481343,"#CD9D91"],[0.37765159584328789,"#CD9D91"],[0.37776514412896378,"#CD9D91"],[0.37796515587891932,"#CD9D91"],[0.37815497008427645,"#CD9D91"],[0.37819013724640638,"#CD9D91"],[0.37819852441634649,"#CD9D91"],[0.37833457740413179,"#CD9D90"],[0.37850396898936378,"#CD9D90"],[0.37866313648479688,"#CD9D90"],[0.37871887428544737,"#CD9D90"],[0.37881207203125,"#CD9D90"],[0.37892245292996884,"#CD9D90"],[0.37895076826746676,"#CD9D90"],[0.37907921833192537,"#CD9D90"],[0.37919741586452949,"#CD9D90"],[0.37923778190767554,"#CD9D90"],[0.37930535500817686,"#CD9D90"],[0.37940303041020662,"#CD9D90"],[0.37949043722372289,"#CD9D90"],[0.37956757110879491,"#CD9D90"],[0.37963442823353244,"#CD9D90"],[0.37963693984787694,"#CD9D90"],[0.37969100527503685,"#CD9D90"],[0.37973729942022572,"#CD9D90"],[0.37974683544303789,"#CD9D90"],[0.37977330836653189,"#CD9D90"],[0.37979903032247553,"#CD9D90"],[0.37981446400810948,"#CD9D90"],[0.37981960865533859,"#CD9D90"],[0.38024601060968455,"#CD9D90"],[0.38034195251062153,"#CD9D90"],[0.38073528351943164,"#CD9D90"],[0.38103745854401416,"#CD9D90"],[0.38121463068316808,"#CD9D90"],[0.38168402901619958,"#CD9C90"],[0.38172342586572183,"#CD9C90"],[0.38214345584353171,"#CD9C90"],[0.38239982269185824,"#CD9C8F"],[0.38259288890508403,"#CD9C8F"],[0.38303230636083685,"#CD9C8F"],[0.38306661754356419,"#CD9C8F"],[0.38346168679590675,"#CD9C8F"],[0.3837237792535787,"#CD9C8F"],[0.38381912726977285,"#CD9C8F"],[0.38388100922554635,"#CD9C8F"],[0.38429025310007003,"#CD9C8F"],[0.38437127697279516,"#CC9C8F"],[0.38463261994723441,"#CC9C8F"],[0.38468939830969695,"#CC9C8F"],[0.38500908017680124,"#CC9C8F"],[0.38507842518931579,"#CC9C8F"],[0.38543680598518792,"#CC9C8F"],[0.38545731452316268,"#CC9C8F"],[0.38563715867239867,"#CC9B8F"],[0.38582604754941252,"#CC9B8F"],[0.38618460596468263,"#CC9B8F"],[0.38623164880173855,"#CC9B8E"],[0.38625548260410092,"#CC9B8E"],[0.38653297192844216,"#CC9B8E"],[0.38686402246060569,"#CC9B8E"],[0.38687112806732926,"#CC9B8E"],[0.38701711205137268,"#CC9B8E"],[0.38719905747937078,"#CC9B8E"],[0.3874627490812379,"#CC9B8E"],[0.38751674373810374,"#CC9B8E"],[0.38779315963205008,"#CC9B8E"],[0.3878241708965946,"#CC9B8E"],[0.38805163366236306,"#CC9B8E"],[0.38812132349135553,"#CC9B8E"],[0.38840818654615639,"#CC9B8E"],[0.38855975569231638,"#CC9B8E"],[0.38863064776376566,"#CC9B8E"],[0.38868474557572696,"#CC9B8E"],[0.38895098658935001,"#CC9B8E"],[0.38919976331498929,"#CC9B8E"],[0.38920689609434378,"#CC9B8E"],[0.38931686463843351,"#CC9B8E"],[0.38945246109942833,"#CC9B8E"],[0.38968766911797803,"#CC9B8E"],[0.38975895262163851,"#CC9B8E"],[0.38991250817115575,"#CC9A8E"],[0.39006445114152521,"#CC9A8E"],[0.39012696679092629,"#CC9A8E"],[0.39030818837163617,"#CC9A8D"],[0.39033103402295133,"#CC9A8D"],[0.39052469942935852,"#CC9A8D"],[0.39070795309138828,"#CC9A8D"],[0.3908024801447344,"#CC9A8D"],[0.39084744364143476,"#CC9A8D"],[0.39088078561191286,"#CC9A8D"],[0.39104318811782968,"#CC9A8D"],[0.39119515226232338,"#CC9A8D"],[0.39133667022699936,"#CC9A8D"],[0.39137669190217828,"#CC9A8D"],[0.39146773472388541,"#CC9A8D"],[0.39153091687039121,"#CC9A8D"],[0.39158833899729972,"#CB9A8D"],[0.39169847682558612,"#CB9A8D"],[0.39179814252271339,"#CB9A8D"],[0.39188733093974015,"#CB9A8D"],[0.39189590702581256,"#CB9A8D"],[0.39196603746614045,"#CB9A8D"],[0.3920342580309949,"#CB9A8D"],[0.39209198910404131,"#CB9A8D"],[0.39213922769658727,"#CB9A8D"],[0.39217597136228333,"#CB9A8D"],[0.39220221819775591,"#CB9A8D"],[0.39221796684309995,"#CB9A8D"],[0.3922232164822318,"#CB9A8D"],[0.39224972682718695,"#CB9A8D"],[0.39240506329113922,"#CB9A8D"],[0.39290413538981184,"#CB9A8D"],[0.392958875817352,"#CB9A8D"],[0.39339309843227011,"#CB9A8D"],[0.39365832994383476,"#CB9A8D"],[0.39387192795361037,"#CB9A8D"],[0.39434059991938775,"#CB998C"],[0.3943480556174791,"#CB998C"],[0.39479909073134789,"#CB998C"],[0.39502801956419586,"#CB998C"],[0.39524737723308578,"#CB998C"],[0.39554084867866268,"#CB998C"],[0.39568543671562739,"#CB998C"],[0.39569818883212682,"#CB998C"],[0.39611324692293126,"#CB998C"],[0.39635853079879702,"#CB998C"],[0.39637013813883282,"#CB998C"],[0.39653078605730907,"#CB998C"],[0.39693803278475925,"#CB998C"],[0.3970090131782531,"#CB998C"],[0.39718998255236793,"#CB998C"],[0.39733496624021292,"#CB998C"],[0.39764960402818406,"#CB998C"],[0.39772156603268916,"#CB998C"],[0.39800034333053025,"#CB998C"],[0.39809781225035434,"#CB998C"],[0.39828027175702063,"#CB988B"],[0.39846368546548638,"#CB988B"],[0.39880118212411098,"#CA988B"],[0.39881916673933882,"#CA988B"],[0.39890098513101135,"#CA988B"],[0.39916423762690134,"#CA988B"],[0.39949888018155633,"#CA988B"],[0.39951171328127089,"#CA988B"],[0.39959246083111555,"#CA988B"],[0.39982307695962771,"#CA988B"],[0.40011242571079819,"#CA988B"],[0.40013681102481768,"#CA988B"],[0.40037414160447782,"#CA988B"],[0.40044006595253245,"#CA988B"],[0.40070309230145962,"#CA988B"],[0.40073282583409064,"#CA988B"],[0.40101507528081548,"#CA988B"],[0.40114618685979775,"#CA988B"],[0.40128368332093611,"#CA988B"],[0.40128679942800494,"#CA988B"],[0.40154798393877955,"#CA988B"],[0.40179861500780656,"#CA988B"],[0.40185416942962848,"#CA988B"],[0.40190855928310099,"#CA988B"],[0.40203867936489412,"#CA988B"],[0.4022681642784588,"#CA988A"],[0.40241452168751934,"#CA988A"],[0.40248705755885983,"#CA978A"],[0.40266122183861708,"#CA978A"],[0.40269534756160064,"#CA978A"],[0.40289302319039411,"#CA978A"],[0.40296471156098734,"#CA978A"],[0.40308007390009226,"#CA978A"],[0.40325648969947414,"#CA978A"],[0.40340413777657358,"#CA978A"],[0.40342226115389601,"#CA978A"],[0.40350471092956985,"#CA978A"],[0.40357737938779603,"#CA978A"],[0.40372183608705758,"#CA978A"],[0.40385562350122528,"#CA978A"],[0.40397873444557542,"#CA978A"],[0.40403449209267217,"#CA978A"],[0.4040911623030371,"#CA978A"],[0.40413727064100091,"#CA978A"],[0.40419290102596561,"#CA978A"],[0.404283945137764,"#CA978A"],[0.40436428973435423,"#CA978A"],[0.40443393048549492,"#CA978A"],[0.40449286363594739,"#CA978A"],[0.40454108600648642,"#CA978A"],[0.40455402777621841,"#CA978A"],[0.40457859499475746,"#CA978A"],[0.40460538857597839,"#CA978A"],[0.40462146530348564,"#CA978A"],[0.40462682430912511,"#CA978A"],[0.40486058427754923,"#CA978A"],[0.40506329113924067,"#CA978A"],[0.40556225578040428,"#CA978A"],[0.40557404284130849,"#CA978A"],[0.40605089574446418,"#C9978A"],[0.40627761080463276,"#C99789"],[0.40652918552865025,"#C99789"],[0.40697125296496306,"#C99689"],[0.40699710008897649,"#C99689"],[0.40723481690648788,"#C99689"],[0.40745461484647305,"#C99689"],[0.40765493445264633,"#C99689"],[0.40790170569333506,"#C99689"],[0.40808048959144338,"#C99689"],[0.40832862073874665,"#C99689"],[0.40833834899898691,"#C99689"],[0.40876452161605759,"#C99689"],[0.40891657627117628,"#C99689"],[0.40899227764284574,"#C99689"],[0.40918020088626328,"#C99689"],[0.4095853646461961,"#C99689"],[0.40964587134082786,"#C99689"],[0.40974303621055597,"#C99689"],[0.4099799912330121,"#C99689"],[0.41028936837264673,"#C99688"],[0.41036405949001908,"#C99688"],[0.41055982891633525,"#C99688"],[0.41073754877215773,"#C99688"],[0.41092273565007131,"#C99588"],[0.41110043895137516,"#C99588"],[0.41136691414548476,"#C99588"],[0.41145271042188736,"#C99588"],[0.41154594046440507,"#C99588"],[0.41179434410532501,"#C99588"],[0.41212532145576386,"#C99588"],[0.41215895049417517,"#C99588"],[0.41216425191356343,"#C99588"],[0.41244562446463273,"#C99588"],[0.41275523566549888,"#C99588"],[0.41276173381279069,"#C99588"],[0.41295180250312158,"#C99588"],[0.41305413813872549,"#C99588"],[0.4133423155160012,"#C89588"],[0.4133542588961614,"#C89588"],[0.41361975198473644,"#C89588"],[0.4137295264721329,"#C89588"],[0.41388643229232513,"#C89588"],[0.41393649463027771,"#C89588"],[0.41414234175026921,"#C89587"],[0.41438746623816203,"#C89587"],[0.41449738466245312,"#C89587"],[0.41450841031874486,"#C89587"],[0.41462179220753059,"#C89587"],[0.41484530668553199,"#C89587"],[0.4150579972785019,"#C89587"],[0.41506997569026938,"#C89587"],[0.41525533820830196,"#C89487"],[0.41525985217535544,"#C89487"],[0.41545086015083432,"#C89487"],[0.41562116090609258,"#C89487"],[0.41563101056860163,"#C89487"],[0.4158002933841799,"#C89487"],[0.41595869914773242,"#C89487"],[0.41600334854476317,"#C89487"],[0.41610621900668454,"#C89487"],[0.41616193656736788,"#C89487"],[0.41624284470818451,"#C89487"],[0.41636856860140059,"#C89487"],[0.41648338363965554,"#C89487"],[0.41658728338239404,"#C89487"],[0.4166802619969846,"#C89487"],[0.41669227372247897,"#C89487"],[0.41674137741630124,"#C89487"],[0.41676231426035215,"#C89487"],[0.41683343556044272,"#C89487"],[0.41689362189751822,"#C89487"],[0.41694286988527907,"#C89487"],[0.41698117675181612,"#C89487"],[0.41700854034039092,"#C89487"],[0.41702495911004167,"#C89487"],[0.41703043213601843,"#C89487"],[0.41721214387429195,"#C89487"],[0.41746938688528989,"#C89487"],[0.41772151898734178,"#C89487"],[0.41818733934054964,"#C89486"],[0.41822037149494451,"#C89486"],[0.41870867430623548,"#C89486"],[0.41889519750588933,"#C89486"],[0.41889935645027443,"#C89486"],[0.41918640081312641,"#C89486"],[0.41959292444864837,"#C89386"],[0.41965352489717966,"#C89386"],[0.41976202946693875,"#C89386"],[0.42011002093639438,"#C89386"],[0.42028048358823766,"#C79386"],[0.42055586381190158,"#C79386"],[0.42061497305072815,"#C79386"],[0.42095783870467196,"#C79386"],[0.42099102891456308,"#C79386"],[0.42141549215147223,"#C79386"],[0.42145814416936667,"#C79386"],[0.42162495394709143,"#C79386"],[0.42182922995235028,"#C79386"],[0.42223221927583798,"#C79385"],[0.42228179384226994,"#C79385"],[0.42229150003383165,"#C79385"],[0.42262443761567403,"#C79385"],[0.42292832330310182,"#C79385"],[0.42300586300676135,"#C79385"],[0.42311499810739617,"#C79385"],[0.42337647403111445,"#C79385"],[0.42356450763706865,"#C79385"],[0.42373624982368552,"#C79285"],[0.423928596114717,"#C79285"],[0.42408517007806468,"#C79285"],[0.42419031255467476,"#C79285"],[0.42442321505205238,"#C79285"],[0.42473225205096521,"#C79285"],[0.42475036557309997,"#C79285"],[0.4248057041778549,"#C79285"],[0.42506660304361288,"#C79285"],[0.42537190944611714,"#C79285"],[0.42541064904834369,"#C79285"],[0.42552592419099544,"#C79285"],[0.42566626734828295,"#C79285"],[0.42594965990780131,"#C79285"],[0.42600511413600539,"#C79285"],[0.42622207087711517,"#C79284"],[0.42630957109855172,"#C79284"],[0.42648348460799723,"#C79284"],[0.42658906684711984,"#C79284"],[0.4267338860559724,"#C79284"],[0.42697326078458575,"#C79284"],[0.42708315163550337,"#C79284"],[0.42716247503261828,"#C79284"],[0.42720159496950749,"#C79284"],[0.42741887540247714,"#C69284"],[0.42762508949508093,"#C69284"],[0.4277253069962671,"#C69284"],[0.42782022528236252,"#C69284"],[0.42784662497110992,"#C69284"],[0.42800427142626252,"#C69184"],[0.4281772172188858,"#C69184"],[0.42827753150279302,"#C69184"],[0.42833905258559424,"#C69184"],[0.42848976808792238,"#C69184"],[0.42859995059130951,"#C69184"],[0.42862935492631415,"#C69184"],[0.42875780494268023,"#C69184"],[0.42881911778594595,"#C69184"],[0.42887511062277084,"#C69184"],[0.42898126509836665,"#C69184"],[0.42907626214928363,"#C69184"],[0.42916009620519058,"#C69184"],[0.42923276234723917,"#C69184"],[0.42929425630950468,"#C69184"],[0.42934308830802681,"#C69184"],[0.42934457448023711,"#C69184"],[0.42935003555649587,"#C69184"],[0.42938371390292052,"#C69184"],[0.42941167227714105,"#C69184"],[0.42942844795926305,"#C69184"],[0.42943403996291152,"#C69184"],[0.42987025501015819,"#C69184"],[0.43007599826849796,"#C69184"],[0.43037974683544311,"#C69183"],[0.43053265892224124,"#C69183"],[0.43079864096460574,"#C69183"],[0.43087848222142588,"#C69183"],[0.43136643286543142,"#C69183"],[0.43141298197321376,"#C69183"],[0.43151097724222265,"#C69183"],[0.4318435709806302,"#C69183"],[0.43221296831055767,"#C69083"],[0.4322834298056154,"#C69083"],[0.43230986930354121,"#C69083"],[0.43276530110143552,"#C69083"],[0.43290457575150099,"#C69083"],[0.43314395692713969,"#C69083"],[0.43320984017963948,"#C69083"],[0.43358576152896333,"#C69083"],[0.43364346088872896,"#C69083"],[0.43399451808889034,"#C69083"],[0.43406613813161365,"#C69083"],[0.43425648799820427,"#C69082"],[0.43447784737050577,"#C59082"],[0.43483506829519525,"#C59082"],[0.43487856463376795,"#C59082"],[0.43491671791514697,"#C59082"],[0.43526826652263839,"#C59082"],[0.43556641444567146,"#C59082"],[0.43564693021782586,"#C59082"],[0.43566556281347857,"#C59082"],[0.43601453348597419,"#C59082"],[0.43620554117488564,"#C59082"],[0.43637105468598814,"#C58F82"],[0.43648595718418748,"#C58F82"],[0.43671647277521997,"#C58F82"],[0.43683406211636544,"#C58F82"],[0.43705076731551018,"#C58F82"],[0.43729620723076956,"#C58F82"],[0.43737391847908058,"#C58F82"],[0.43745194172136181,"#C58F82"],[0.43768590705427368,"#C58F82"],[0.43798671445113713,"#C58F82"],[0.43805914488796904,"#C58F82"],[0.43809626906969656,"#C58F82"],[0.43827632270684669,"#C58F81"],[0.43855471449096683,"#C58F81"],[0.43865563697024867,"#C58F81"],[0.43882187311054344,"#C58F81"],[0.43888609912053078,"#C58F81"],[0.43907778251502605,"#C58F81"],[0.43924138378730548,"#C58F81"],[0.43932242730101645,"#C58F81"],[0.43955579271683987,"#C58F81"],[0.43966565411602965,"#C58F81"],[0.43977786466693625,"#C58F81"],[0.43981635163230892,"#C58F81"],[0.43998862971606756,"#C58F81"],[0.44018807509334001,"#C58F81"],[0.44037618869603634,"#C58F81"],[0.44038050728145639,"#C58F81"],[0.44043489111228429,"#C58F81"],[0.44055295909325709,"#C58F81"],[0.44071837552936755,"#C58E81"],[0.44087242792724801,"#C58E81"],[0.44093381800287235,"#C58E81"],[0.44101510689134593,"#C58E81"],[0.44114640371052583,"#C58E81"],[0.44119376749888739,"#C58E81"],[0.44126631036071762,"#C58E81"],[0.44137481950735924,"#C58E81"],[0.44147192450763306,"#C58E81"],[0.4414762515654389,"#C58E81"],[0.44155761941249405,"#C48E81"],[0.44163189896848798,"#C48E81"],[0.44169475861935981,"#C48E81"],[0.44174619450744879,"#C48E81"],[0.44178620347487141,"#C48E81"],[0.44181478306449007,"#C48E81"],[0.44183193152066724,"#C48E81"],[0.44183764778980483,"#C48E81"],[0.44194224100912616,"#C48E81"],[0.44200777624755161,"#C48E81"],[0.44213277014267438,"#C48E81"],[0.44252836084579672,"#C48E80"],[0.44268026973019614,"#C48E80"],[0.44303142758041847,"#C48E80"],[0.44303797468354433,"#C48E80"],[0.44340781211342906,"#C48E80"],[0.44353658761945158,"#C48E80"],[0.44392006180065313,"#C48E80"],[0.44402417005587147,"#C48E80"],[0.44412482698453337,"#C48E80"],[0.44450069294716221,"#C48E80"],[0.44479862467503362,"#C48E80"],[0.44483127355383922,"#C48E80"],[0.4449661278078918,"#C48D80"],[0.44542044672093239,"#C48D80"],[0.44552711142654455,"#C48D80"],[0.44566706831729619,"#C48D80"],[0.44586362234544008,"#C48D80"],[0.44621230061295769,"#C48D80"],[0.44629562792471456,"#C48D80"],[0.44652534509391451,"#C48D7F"],[0.44671643729393395,"#C48D7F"],[0.44688680153872951,"#C48D7F"],[0.44712602488775921,"#C48D7F"],[0.44737340763482825,"#C48D7F"],[0.44752436574780408,"#C48D7F"],[0.44755057505507112,"#C48D7F"],[0.44791143552996515,"#C48D7F"],[0.44820358244895186,"#C48D7F"],[0.44821120884423971,"#C48D7F"],[0.44828721051160714,"#C48D7F"],[0.44865166759859909,"#C38D7F"],[0.44884578545327192,"#C38D7F"],[0.44900478433219604,"#C38D7F"],[0.44903870191147655,"#C38D7F"],[0.44934653889576237,"#C38C7F"],[0.44947714625700308,"#C38C7F"],[0.44967691012133193,"#C38C7F"],[0.44985584032191295,"#C38C7F"],[0.44999587749599979,"#C38C7F"],[0.45009762751529458,"#C38C7F"],[0.45030342116814293,"#C38C7F"],[0.45059952195346331,"#C38C7E"],[0.45066257786794772,"#C38C7E"],[0.45070719235953549,"#C38C7E"],[0.45088416134085141,"#C38C7E"],[0.45115732149806409,"#C38C7E"],[0.45130580440737011,"#C38C7E"],[0.45141898527721469,"#C38C7E"],[0.45145886866003315,"#C38C7E"],[0.45166913622006977,"#C38C7E"],[0.45189342777266017,"#C38C7E"],[0.45190775856315013,"#C38C7E"],[0.45213483724263137,"#C38C7E"],[0.45224466713774936,"#C38C7E"],[0.45235035789904143,"#C38C7E"],[0.45247002707538719,"#C38C7E"],[0.4525543068817508,"#C38C7E"],[0.45274667125325341,"#C38C7E"],[0.45292743879323361,"#C38C7E"],[0.45301992808092051,"#C38C7E"],[0.45303556745149098,"#C38C7E"],[0.45309659800241697,"#C38C7E"],[0.45325413810620319,"#C38C7E"],[0.45340004905807596,"#C38B7E"],[0.45353432154278994,"#C38B7E"],[0.45359001456263637,"#C38B7E"],[0.45365694697933034,"#C38B7E"],[0.4536975757719478,"#C38B7E"],[0.45376791752364476,"#C38B7E"],[0.45378460662076725,"#C38B7E"],[0.45386722607114349,"#C38B7E"],[0.4539548662589683,"#C38B7E"],[0.45403083246802556,"#C38B7E"],[0.45409511982478545,"#C38B7E"],[0.45413333460590433,"#C38B7E"],[0.45414772420284288,"#C38B7E"],[0.4541886422242406,"#C38B7E"],[0.45421787126055269,"#C38B7E"],[0.45423540943372898,"#C38B7E"],[0.45424125561669804,"#C38B7E"],[0.45453865825109041,"#C38B7D"],[0.45461528878060098,"#C38B7D"],[0.45466549432340031,"#C38B7D"],[0.45518646101177396,"#C38B7D"],[0.45528203883948015,"#C38B7D"],[0.45552282854416215,"#C38B7D"],[0.45569620253164556,"#C28B7D"],[0.45601470463854565,"#C28B7D"],[0.45619468731693169,"#C28B7D"],[0.45642014410806686,"#C28B7D"],[0.45668188438406543,"#C28B7D"],[0.45673661229716023,"#C28B7D"],[0.45715776334110425,"#C28B7D"],[0.45730718475669707,"#C28B7D"],[0.4574477188717152,"#C28B7D"],[0.45762229439672086,"#C28B7D"],[0.45807544836907033,"#C28A7D"],[0.45814798183737759,"#C28A7D"],[0.45818390002495235,"#C28A7D"],[0.45851719669452728,"#C28A7C"],[0.45883735909934564,"#C28A7C"],[0.4589475114362892,"#C28A7C"],[0.45905023970991332,"#C28A7C"],[0.45936636529283736,"#C28A7C"],[0.45951580900409639,"#C28A7C"],[0.45977373160625246,"#C28A7C"],[0.45990615388259082,"#C28A7C"],[0.46016958437037758,"#C28A7C"],[0.46018329035061867,"#C28A7C"],[0.46055389823882231,"#C28A7C"],[0.4607515928997552,"#C28A7C"],[0.4608397624016265,"#C28A7C"],[0.46092664853280607,"#C28A7C"],[0.46128781124882934,"#C28A7C"],[0.46148518489474499,"#C28A7C"],[0.46158650741584384,"#C28A7C"],[0.46163736306617342,"#C28A7C"],[0.46197528135421906,"#C2897C"],[0.46211951805366513,"#C2897C"],[0.46230154417958169,"#C2897C"],[0.46241084839493918,"#C2897C"],[0.46261613031305526,"#C1897B"],[0.46274272259925775,"#C1897B"],[0.46291901923636303,"#C1897B"],[0.46321019114870743,"#C1897B"],[0.46322456712281324,"#C1897B"],[0.46335475976064322,"#C1897B"],[0.4634896269731158,"#C1897B"],[0.46375730836257734,"#C1897B"],[0.46395559128620889,"#C1897B"],[0.46401321770596671,"#C1897B"],[0.46402761521903435,"#C1897B"],[0.46425733813374803,"#C1897B"],[0.46448965352345883,"#C1897B"],[0.46454517945456775,"#C1897B"],[0.46471014850496628,"#C1897B"],[0.46481994464912846,"#C1897B"],[0.46491880846549327,"#C1897B"],[0.46511561955441083,"#C1897B"],[0.46512348708545226,"#C1897B"],[0.4652247852971737,"#C1897B"],[0.46530056868779224,"#C1897B"],[0.46547364355272713,"#C1897B"],[0.46560150773679154,"#C1897B"],[0.46563483261138938,"#C1897B"],[0.4656904775505365,"#C1897B"],[0.46578412510485911,"#C1897B"],[0.46592151105669311,"#C1897B"],[0.46604698127624244,"#C1897B"],[0.46616052736171443,"#C1897B"],[0.46616231420508114,"#C1897B"],[0.46624611478417943,"#C1887B"],[0.46626214170297553,"#C1887B"],[0.46635181748409527,"#C1887B"],[0.46637225717614594,"#C1887B"],[0.46642954868562647,"#C1887B"],[0.46649533008662203,"#C1887B"],[0.46654915726638624,"#C1887B"],[0.46659102660595864,"#C1887A"],[0.46662093528932935,"#C1887A"],[0.46663888130438624,"#C1887A"],[0.46664486344359124,"#C1887A"],[0.46679036329408374,"#C1887A"],[0.46708951804307963,"#C1887A"],[0.46713214604403641,"#C1887A"],[0.46732318817186236,"#C1887A"],[0.46784455510350631,"#C1887A"],[0.46788112781235691,"#C1887A"],[0.4680063428249337,"#C1887A"],[0.46835443037974689,"#C1887A"],[0.46861915636040619,"#C1887A"],[0.46885278090630667,"#C1887A"],[0.46891273479802864,"#C1887A"],[0.4693395742140305,"#C1887A"],[0.46934618598726174,"#C1887A"],[0.46980864045594051,"#C0887A"],[0.46981477846889108,"#C0887A"],[0.4700621714241684,"#C0887A"],[0.47027836248186161,"#C0887A"],[0.47069400655111648,"#C08779"],[0.47073029571865066,"#C08779"],[0.47076706784693467,"#C08779"],[0.47117054830928884,"#C08779"],[0.47146083088832769,"#C08779"],[0.47156878010766345,"#C08779"],[0.47159909105756492,"#C08779"],[0.47201589545030143,"#C08779"],[0.47214341665046455,"#C08779"],[0.47242093366646476,"#C08779"],[0.47243290843423658,"#C08779"],[0.47281417858610364,"#C08779"],[0.47281478171718894,"#C08779"],[0.47319560379910786,"#C08779"],[0.47328633913702556,"#C08779"],[0.47347488316642716,"#C08779"],[0.4735651836137823,"#C08779"],[0.47392289306523039,"#C08779"],[0.4741236785825188,"#C08779"],[0.47412902013283109,"#C08779"],[0.47426870792353859,"#C08779"],[0.47460260470175897,"#C08779"],[0.47476112606851095,"#C08678"],[0.4749245606636805,"#C08678"],[0.47496089966222654,"#C08678"],[0.47523455383138657,"#C08678"],[0.47538718425841187,"#C08678"],[0.4755325629925905,"#C08678"],[0.47578192630280025,"#C08678"],[0.47581856770774467,"#C08678"],[0.4760018123293952,"#C08678"],[0.47609254831691716,"#C08678"],[0.47635448594643215,"#C08678"],[0.47659204898246998,"#BF8678"],[0.47660436251526606,"#BF8678"],[0.47660497001394675,"#BF8678"],[0.47671191416418812,"#BF8678"],[0.47684216074119756,"#BF8678"],[0.47706786414670499,"#BF8678"],[0.47719661761194887,"#BF8678"],[0.47728145706460612,"#BF8678"],[0.47739121699286591,"#BF8678"],[0.47748292464343756,"#BF8678"],[0.47767006088859076,"#BF8678"],[0.47767225285256754,"#BF8678"],[0.47777671600269078,"#BF8678"],[0.47784942848703993,"#BF8678"],[0.4780144391721437,"#BF8678"],[0.47816727336770581,"#BF8678"],[0.47817938000277471,"#BF8678"],[0.47830792037210312,"#BF8678"],[0.47834522665680135,"#BF8678"],[0.47843637032599062,"#BF8678"],[0.47855261421574213,"#BF8678"],[0.47861772920743528,"#BF8678"],[0.47865664387660189,"#BF8678"],[0.47874845199554361,"#BF8678"],[0.47882803211383473,"#BF8677"],[0.4788953786293042,"#BF8677"],[0.47890211164809382,"#BF8677"],[0.47895048679831154,"#BF8677"],[0.47895648807163771,"#BF8677"],[0.47899335273741572,"#BF8677"],[0.47902397342474234,"#BF8677"],[0.47904234670104873,"#BF8577"],[0.47904847127048444,"#BF8577"],[0.47944733366531522,"#BF8577"],[0.47955486188095087,"#BF8577"],[0.47972249166309666,"#BF8577"],[0.47998085602379437,"#BF8577"],[0.48047734165858202,"#BF8577"],[0.48048140189502064,"#BF8577"],[0.48050264267697762,"#BF8577"],[0.48101265822784822,"#BF8577"],[0.48122098937093349,"#BF8577"],[0.48139729247483465,"#BF8577"],[0.48151086794021714,"#BF8577"],[0.48195338655804854,"#BF8577"],[0.48199723774988257,"#BF8577"],[0.48230247709867924,"#BF8577"],[0.48247173427564505,"#BF8577"],[0.48267448543654989,"#BF8577"],[0.48293432483017451,"#BF8576"],[0.48319689951185762,"#BF8576"],[0.48338423869546499,"#BF8476"],[0.48338497743071895,"#BF8476"],[0.48382366080964911,"#BE8476"],[0.48408050374073608,"#BE8476"],[0.48408259950990973,"#BE8476"],[0.48425034442482884,"#BE8476"],[0.48466499846980582,"#BE8476"],[0.48476952155476827,"#BE8476"],[0.48495323410691105,"#BE8476"],[0.4850675938838136,"#BE8476"],[0.48544495901836238,"#BE8476"],[0.48545810236157916,"#BE8476"],[0.48581503524148972,"#BE8476"],[0.48583649636292614,"#BE8476"],[0.48610886661610009,"#BE8476"],[0.48620274912216821,"#BE8476"],[0.4865568346572855,"#BE8476"],[0.48666585209948032,"#BE8476"],[0.48676119960409669,"#BE8476"],[0.48689872777887533,"#BE8476"],[0.48722840409887214,"#BE8475"],[0.48740191379276032,"#BE8475"],[0.48750562997428271,"#BE8475"],[0.48754584003902901,"#BE8475"],[0.48785101283915289,"#BE8375"],[0.48803096556033232,"#BE8375"],[0.48814390056508972,"#BE8375"],[0.48815626381755073,"#BE8375"],[0.48833431451227527,"#BE8375"],[0.48842448211645006,"#BE8375"],[0.48864831186637425,"#BE8375"],[0.48869273723407192,"#BE8375"],[0.48894864650721104,"#BE8375"],[0.48913587444054241,"#BE8375"],[0.48915185172749054,"#BE8375"],[0.48919219138045722,"#BE8375"],[0.48925391026519438,"#BE8375"],[0.48942335416036742,"#BE8375"],[0.48964211802181234,"#BE8375"],[0.48984771891920198,"#BE8375"],[0.48984846701402907,"#BE8375"],[0.48995818801637192,"#BE8375"],[0.4900423860663784,"#BE8375"],[0.49010485216241573,"#BE8375"],[0.49022386099379722,"#BE8375"],[0.49039287850194613,"#BD8375"],[0.49042969661218372,"#BD8375"],[0.49054942619204434,"#BD8375"],[0.49069349256539008,"#BD8375"],[0.49075327017260528,"#BD8375"],[0.49082506702756101,"#BD8375"],[0.49094413989229313,"#BD8375"],[0.49099980276249111,"#BD8375"],[0.49105070238503234,"#BD8375"],[0.49106313625042175,"#BD8375"],[0.49114474664615815,"#BD8374"],[0.49122626573387396,"#BD8374"],[0.49129525362676563,"#BD8374"],[0.49135170522602056,"#BD8374"],[0.4913956163573111,"#BD8374"],[0.49142698377233573,"#BD8374"],[0.49144580515002056,"#BD8374"],[0.49145207909737765,"#BD8374"],[0.49153704540201704,"#BD8374"],[0.49155799743613149,"#BD8374"],[0.49201066618632261,"#BD8274"],[0.49210424135975206,"#BD8274"],[0.49230946133753117,"#BD8274"],[0.49263849593350972,"#BD8274"],[0.49294738168121743,"#BD8274"],[0.49307046605417915,"#BD8274"],[0.4931607232438161,"#BD8274"],[0.49367088607594944,"#BD8274"],[0.49382000808415127,"#BD8274"],[0.49387322269053557,"#BD8274"],[0.49416894792652466,"#BD8274"],[0.49455803643188434,"#BD8274"],[0.49465487301581135,"#BD8274"],[0.49478812942918915,"#BD8274"],[0.49512862629989129,"#BD8274"],[0.49528450058917517,"#BD8273"],[0.49559017348264711,"#BD8273"],[0.49569204238688302,"#BD8273"],[0.49599935055031297,"#BD8273"],[0.49603948102757156,"#BD8273"],[0.4964765161693897,"#BD8173"],[0.49658490234357178,"#BD8173"],[0.49670253682721943,"#BD8173"],[0.49690124692548432,"#BD8173"],[0.49731364210711626,"#BC8173"],[0.49739401046458986,"#BC8173"],[0.49746665038506044,"#BC8173"],[0.49771367133043087,"#BC8173"],[0.49807372305502551,"#BC8173"],[0.49810130502724104,"#BC8173"],[0.49833722791874091,"#BC8173"],[0.49847651445557917,"#BC8173"],[0.49874162675414591,"#BC8173"],[0.49883927171000986,"#BC8173"],[0.49918954973169338,"#BC8173"],[0.49919657668945838,"#BC8173"],[0.49939767429567539,"#BC8172"],[0.49952732231819408,"#BC8172"],[0.49955489937960595,"#BC8172"],[0.49985256413302315,"#BC8172"],[0.50004181900648947,"#BC8172"],[0.5000446387954981,"#BC8172"],[0.50016525071490991,"#BC8172"],[0.50046535848679308,"#BC8072"],[0.50055686685131329,"#BC8072"],[0.50067401482161689,"#BC8072"],[0.50075286476452419,"#BC8072"],[0.50088135670468836,"#BC8072"],[0.50102774776527592,"#BC8072"],[0.50128998661564972,"#BC8072"],[0.50129421629918092,"#BC8072"],[0.50153956135947286,"#BC8072"],[0.50154804619295601,"#BC8072"],[0.50170667327060936,"#BC8072"],[0.50177645296528106,"#BC8072"],[0.50190237863527631,"#BC8072"],[0.50200064333347871,"#BC8072"],[0.50221211530317111,"#BC8072"],[0.50241085265866192,"#BC8072"],[0.50249845767876744,"#BC8072"],[0.50252053174890099,"#BC8072"],[0.50252837292062136,"#BC8072"],[0.50259684013561134,"#BC8072"],[0.50277006342684927,"#BC8072"],[0.50293050918783755,"#BC8072"],[0.50307816504177683,"#BC8072"],[0.50308240994599829,"#BC8072"],[0.50321301958435449,"#BC8072"],[0.50332287581366175,"#BC8072"],[0.5033350623881282,"#BC8072"],[0.50344428400654162,"#BC8072"],[0.50349778274995449,"#BC8071"],[0.50354067597756824,"#BC8071"],[0.50362423082698138,"#BC8071"],[0.50365419263540567,"#BC8071"],[0.50369494207124577,"#BC8071"],[0.50375280422002955,"#BC8071"],[0.50379781277833247,"#BC8071"],[0.50382996424823134,"#BC8071"],[0.50384925613023812,"#BC8071"],[0.50385568692427096,"#BC8071"],[0.50411364957392857,"#BC8071"],[0.50421376364202386,"#BB8071"],[0.50445621161225263,"#BB8071"],[0.50476108157186872,"#BB7F71"],[0.50489279759023109,"#BB7F71"],[0.5052961057561951,"#BB7F71"],[0.50540359567076121,"#BB7F71"],[0.50566026489120919,"#BB7F71"],[0.50581879626561244,"#BB7F71"],[0.50632911392405067,"#BB7F71"],[0.50633987133716651,"#BB7F71"],[0.50641599699028617,"#BB7F71"],[0.50682702032256488,"#BB7F71"],[0.50715993990238684,"#BB7F71"],[0.50726497528827841,"#BB7F71"],[0.50731247783296873,"#BB7F71"],[0.50778544962128547,"#BB7F70"],[0.50789204016069101,"#BB7F70"],[0.50817884448289674,"#BB7F70"],[0.50824589966100597,"#BB7F70"],[0.5086122448334135,"#BB7F70"],[0.50869379274614401,"#BB7F70"],[0.50908141617885483,"#BB7E70"],[0.50912909450407784,"#BB7E70"],[0.50932050154059882,"#BB7E70"],[0.50955177140816743,"#BB7E70"],[0.50996179079013815,"#BB7E70"],[0.50997262795023302,"#BB7E70"],[0.51001675847092076,"#BB7E70"],[0.51035912085221824,"#BB7E70"],[0.51070096439847679,"#BB7E70"],[0.51074373067902457,"#BB7E70"],[0.51085241770473289,"#BB7E70"],[0.51090462466411479,"#BB7E70"],[0.5111155902491803,"#BA7E70"],[0.51137306869956556,"#BA7E70"],[0.51147467044666151,"#BA7E70"],[0.51172072370120858,"#BA7E6F"],[0.51182094307185722,"#BA7E6F"],[0.51192989162480873,"#BA7E6F"],[0.51203302136943685,"#BA7E6F"],[0.51215438085233789,"#BA7E6F"],[0.51247495745331928,"#BA7E6F"],[0.51257748456734165,"#BA7E6F"],[0.51268077303900306,"#BA7E6F"],[0.51278264748781566,"#BA7E6F"],[0.51294421500812282,"#BA7E6F"],[0.5130774265264717,"#BA7E6F"],[0.51331627499150034,"#BA7E6F"],[0.51335927110706492,"#BA7D6F"],[0.51342263931745569,"#BA7D6F"],[0.51362815874366974,"#BA7D6F"],[0.51388406793547614,"#BA7D6F"],[0.51393947917908789,"#BA7D6F"],[0.51394752630091622,"#BA7D6F"],[0.51412697817525332,"#BA7D6F"],[0.51425612737045912,"#BA7D6F"],[0.51435686995745211,"#BA7D6F"],[0.51455033823937424,"#BA7D6F"],[0.51457372478593888,"#BA7D6F"],[0.51477752518135156,"#BA7D6F"],[0.51493975717009588,"#BA7D6F"],[0.5149682546880745,"#BA7D6F"],[0.51507788856790748,"#BA7D6F"],[0.51514589788082277,"#BA7D6F"],[0.51514880551185849,"#BA7D6F"],[0.51531044037083229,"#BA7D6F"],[0.51546186881164691,"#BA7D6F"],[0.51560017090450061,"#BA7D6F"],[0.51572533540328735,"#BA7D6F"],[0.51573483505427353,"#BA7D6F"],[0.51583735211911463,"#BA7D6F"],[0.51588786319217728,"#BA7D6E"],[0.51592083948007561,"#BA7D6E"],[0.51593621192443662,"#BA7D6E"],[0.51602190675676252,"#BA7D6E"],[0.51609442962193741,"#BA7D6E"],[0.51615377459699208,"#BA7D6E"],[0.51619993683255805,"#BA7D6E"],[0.51623291255484793,"#BA7D6E"],[0.51625269906719673,"#BA7D6E"],[0.51625929475116417,"#BA7D6E"],[0.51630838165882209,"#BA7D6E"],[0.51668599198473941,"#BA7D6E"],[0.51686940086828903,"#BA7D6E"],[0.51689070531047943,"#BA7D6E"],[0.51741784899202248,"#BA7D6E"],[0.51747221616452288,"#BA7D6E"],[0.51784928697408372,"#B97C6E"],[0.51795368312176793,"#B97C6E"],[0.51824647744635988,"#B97C6E"],[0.51847686114734459,"#B97C6E"],[0.51879651703499163,"#B97C6E"],[0.518987341772152,"#B97C6E"],[0.519008718059499,"#B97C6E"],[0.51948508452849296,"#B97C6E"],[0.51973232832703298,"#B97C6E"],[0.51975888076617749,"#B97C6E"],[0.51997004979270223,"#B97C6E"],[0.52044219880006737,"#B97C6D"],[0.52049690888024025,"#B97C6D"],[0.52065665397238181,"#B97C6D"],[0.52090149365952976,"#B97C6D"],[0.52122274628579413,"#B97C6D"],[0.5213478973681539,"#B97C6D"],[0.52156942740038548,"#B97C6D"],[0.52178137382535261,"#B97C6D"],[0.52193633745588697,"#B97C6D"],[0.52220188784685528,"#B97B6D"],[0.52220195418022963,"#B97B6D"],[0.52247058236659472,"#B97B6D"],[0.52260940517840804,"#B97B6D"],[0.52263762747119646,"#B97B6D"],[0.52300389250919499,"#B97B6D"],[0.52325151588745245,"#B97B6D"],[0.5233265620387193,"#B97B6D"],[0.5233600529719884,"#B97B6D"],[0.52338531748496453,"#B97B6D"],[0.52375364872085506,"#B97B6D"],[0.52400308751044622,"#B97B6D"],[0.5241088558139041,"#B97B6D"],[0.52423777368238422,"#B97B6C"],[0.5242899789700719,"#B97B6C"],[0.5244509093552312,"#B97B6C"],[0.52466715090201155,"#B87B6C"],[0.52477978094188416,"#B87B6C"],[0.52509544318833612,"#B87B6C"],[0.52510367934802338,"#B87B6C"],[0.52531727058672184,"#B87B6C"],[0.5253186999113022,"#B87B6C"],[0.52539786973762514,"#B87B6C"],[0.52568703527212346,"#B87B6C"],[0.52595768293701473,"#B87B6C"],[0.52595770522332308,"#B87B6C"],[0.52596291552392904,"#B87B6C"],[0.52622548728486729,"#B87B6C"],[0.52633331805113581,"#B87A6C"],[0.52647472841609444,"#B87A6C"],[0.52658404909714607,"#B87A6C"],[0.52671061785729467,"#B87A6C"],[0.52679978698678398,"#B87A6C"],[0.52693313563545985,"#B87A6C"],[0.52714226287324562,"#B87A6C"],[0.52719774824740395,"#B87A6C"],[0.52733798179689395,"#B87A6C"],[0.52733804885106772,"#B87A6C"],[0.52752027574371585,"#B87A6C"],[0.52762986076104457,"#B87A6C"],[0.52768912916912736,"#B87A6C"],[0.52779873099952468,"#B87A6C"],[0.52784452765322909,"#B87A6C"],[0.52798645790692644,"#B87A6C"],[0.52811490777758274,"#B87A6C"],[0.5282298662541991,"#B87A6C"],[0.52833132347211709,"#B87A6B"],[0.52833139066750801,"#B87A6B"],[0.52838694873948278,"#B87A6B"],[0.52841927071723904,"#B87A6B"],[0.52844786313306824,"#B87A6B"],[0.52849370042976229,"#B87A6B"],[0.52855460620742178,"#B87A6B"],[0.52860198280824144,"#B87A6B"],[0.52863582615278648,"#B87A6B"],[0.5286561333259201,"#B87A6B"],[0.52866290257805737,"#B87A6B"],[0.52896235364557809,"#B87A6B"],[0.52925373117445629,"#B87A6B"],[0.52931327139418893,"#B87A6B"],[0.52952489870638864,"#B87A6B"],[0.53004740246187088,"#B87A6B"],[0.53007453773857227,"#B87A6B"],[0.53028361915737277,"#B87A6B"],[0.53061122540450412,"#B8796B"],[0.53082881509755875,"#B8796B"],[0.53113491722973438,"#B8796B"],[0.53124236233591471,"#B8796B"],[0.53159790772996252,"#B7796B"],[0.53164556962025311,"#B7796B"],[0.53214313987954787,"#B7796B"],[0.53218942958159465,"#B7796B"],[0.53235461957440555,"#B7796B"],[0.5326275862254366,"#B7796A"],[0.53309886780666593,"#B7796A"],[0.53309889043384007,"#B7796A"],[0.53312474983970726,"#B7796A"],[0.53344308173848809,"#B7796A"],[0.5335569447192563,"#B7796A"],[0.53383066071964169,"#B7796A"],[0.53400177802258231,"#B7796A"],[0.5340482523699045,"#B7796A"],[0.53443332975517177,"#B7796A"],[0.53451798907788106,"#B7796A"],[0.53454987147243971,"#B7796A"],[0.53485156295021175,"#B7796A"],[0.53495986676727925,"#B7786A"],[0.53525644165074526,"#B7786A"],[0.53525646438296615,"#B7786A"],[0.5355816438847596,"#B7786A"],[0.53564793092454555,"#B7786A"],[0.535859522983682,"#B7786A"],[0.53595038181291199,"#B7786A"],[0.53602599687865449,"#B7786A"],[0.53639060667357152,"#B7786A"],[0.53663156681577318,"#B77869"],[0.53663396866869151,"#B77869"],[0.53674172853707836,"#B77869"],[0.53674715134925943,"#B77869"],[0.53707933177768874,"#B77869"],[0.53729996315767314,"#B77869"],[0.5374033867977086,"#B77869"],[0.53762268259420543,"#B77869"],[0.53767488606291991,"#B77869"],[0.5377138651058937,"#B77869"],[0.53795551533814612,"#B77869"],[0.53801073932969468,"#B77869"],[0.53829398322707434,"#B67869"],[0.53848604787071297,"#B67869"],[0.53856357169788915,"#B67869"],[0.53859816861086518,"#B67869"],[0.53870431884483971,"#B67869"],[0.53881948079482034,"#B67869"],[0.53906168773384522,"#B67869"],[0.53922786900429898,"#B67769"],[0.53929017090423859,"#B67769"],[0.53933717877511411,"#B67769"],[0.53950490987809419,"#B67769"],[0.53970588541935394,"#B67769"],[0.53972218995683208,"#B67769"],[0.53984456334228392,"#B67769"],[0.53989307949234044,"#B67769"],[0.54006647526977902,"#B67769"],[0.54017600737019977,"#B67769"],[0.54022605714030514,"#B67769"],[0.5403718107154466,"#B67769"],[0.5404481992644905,"#B67769"],[0.54050372283607484,"#B67769"],[0.54062178157831819,"#B67769"],[0.54072597625893071,"#B67769"],[0.54072842252744613,"#B67769"],[0.54081629744011139,"#B67768"],[0.54089273693376805,"#B67768"],[0.54095528780522195,"#B67768"],[0.54100246620770165,"#B67768"],[0.54100394437634969,"#B67768"],[0.54103870222815775,"#B67768"],[0.54103872524677232,"#B67768"],[0.54105955820278773,"#B67768"],[0.54106651040495057,"#B67768"],[0.54161609062137872,"#B67768"],[0.54172293989292497,"#B67768"],[0.54181648835092755,"#B67768"],[0.54218024559701372,"#B67768"],[0.54261800739753463,"#B67768"],[0.54270566561906597,"#B67768"],[0.54273114127872712,"#B67768"],[0.54326872968761797,"#B67768"],[0.54340695750242785,"#B67768"],[0.54367652352340945,"#B67668"],[0.54379296378033437,"#B67668"],[0.54418327340076711,"#B67668"],[0.54430379746835444,"#B67668"],[0.54462384522198182,"#B67668"],[0.54463543769774581,"#B67668"],[0.54480118563702751,"#B67668"],[0.54494689043107047,"#B57668"],[0.54528508416436194,"#B57667"],[0.54558233253093269,"#B57667"],[0.54569774455839792,"#B57667"],[0.54572520777085365,"#B57667"],[0.54575544993954073,"#B57667"],[0.54621224088114839,"#B57667"],[0.54643577239759822,"#B57667"],[0.54651713273201352,"#B57667"],[0.54665541595509182,"#B57667"],[0.54681516589859624,"#B57667"],[0.54708493519219847,"#B57667"],[0.54716091123660471,"#B57667"],[0.54743976335362499,"#B57667"],[0.54750075970547596,"#B57667"],[0.54787309905976267,"#B57567"],[0.54789363712234529,"#B57567"],[0.54790285170701436,"#B57567"],[0.54829117452451692,"#B57567"],[0.54835014981568553,"#B57567"],[0.54857227457117097,"#B57567"],[0.54866569261744214,"#B57567"],[0.54896053904378994,"#B57567"],[0.54902637159274137,"#B57567"],[0.5492482179293503,"#B57566"],[0.54925837721802129,"#B57566"],[0.54937317822017595,"#B57566"],[0.54970608044719893,"#B57566"],[0.54993134721391779,"#B57566"],[0.55001578937129614,"#B57566"],[0.55002504741338543,"#B57566"],[0.55013389392122281,"#B57566"],[0.55033004946439934,"#B57566"],[0.55059112556215739,"#B57566"],[0.55062105816547735,"#B57566"],[0.55089804631442174,"#B57566"],[0.55100710445781131,"#B57566"],[0.55105930594245622,"#B57566"],[0.55116098795408464,"#B57566"],[0.5512376540789542,"#B57566"],[0.55140985838433154,"#B57566"],[0.55164463417347187,"#B47566"],[0.55186529316914501,"#B47566"],[0.55186777667021292,"#B47566"],[0.55187087541658908,"#B47566"],[0.55207181450864795,"#B47566"],[0.55209100674705969,"#B47566"],[0.55226417862869637,"#B47466"],[0.55244236727460572,"#B47466"],[0.5524907330864639,"#B47466"],[0.55260636350888481,"#B47466"],[0.55271583817901648,"#B47466"],[0.55275615171923098,"#B47466"],[0.55289171762591893,"#B47466"],[0.55301304828857401,"#B47466"],[0.55309717148204507,"#B47466"],[0.55311080995047757,"#B47466"],[0.55312013211232447,"#B47466"],[0.55321295885332311,"#B47466"],[0.55329151962363587,"#B47466"],[0.5533558068954878,"#B47465"],[0.55340581450486481,"#B47465"],[0.55344153765446591,"#B47465"],[0.55346297291600266,"#B47465"],[0.55347011823184378,"#B47465"],[0.55355121711940636,"#B47465"],[0.55369013590167082,"#B47465"],[0.55411863391745553,"#B47465"],[0.55426957257121023,"#B47465"],[0.55437384216645302,"#B47465"],[0.55483542866654767,"#B47465"],[0.55511439723630529,"#B47465"],[0.55518364256057606,"#B47465"],[0.55538765233587672,"#B47465"],[0.5557396870331599,"#B47465"],[0.55592619272178156,"#B47465"],[0.55598054813316167,"#B47465"],[0.55609801874348652,"#B47465"],[0.556450999983087,"#B47465"],[0.55676448933231915,"#B47365"],[0.55686867613334401,"#B47365"],[0.55696202531645578,"#B47365"],[0.55706941754857076,"#B47365"],[0.55745922097771339,"#B47365"],[0.557535397248758,"#B47365"],[0.55794254030288104,"#B47364"],[0.55798611198685411,"#B47364"],[0.55802851305957668,"#B47364"],[0.55829320364176982,"#B47364"],[0.55841193772889441,"#B37364"],[0.55886736881399057,"#B37364"],[0.55897522500866537,"#B37364"],[0.55903784096529341,"#B37364"],[0.55909190675216369,"#B37364"],[0.55930879025774072,"#B37364"],[0.55973615992071046,"#B37364"],[0.55976924239404768,"#B37364"],[0.55990947347818532,"#B37364"],[0.56014943684372664,"#B37364"],[0.56018597262405367,"#B37364"],[0.56048734184970972,"#B37364"],[0.56054858126673279,"#B37364"],[0.56083117892705425,"#B37264"],[0.56093355464721029,"#B37264"],[0.56119207402712157,"#B37264"],[0.56126822185745562,"#B37264"],[0.56130431967815198,"#B37264"],[0.56166084030556174,"#B37264"],[0.5617402622174652,"#B37264"],[0.56188337442050129,"#B37263"],[0.56200308174546998,"#B37263"],[0.56233101050043888,"#B37263"],[0.56233856679180638,"#B37263"],[0.56256117934964178,"#B37263"],[0.56263664464190266,"#B37263"],[0.56264459437554626,"#B37263"],[0.56294380249382536,"#B37263"],[0.56322542598607228,"#B37263"],[0.56322860531114882,"#B37263"],[0.56339691987590879,"#B37263"],[0.56349897463053511,"#B37263"],[0.56352024795045452,"#B37263"],[0.56375488361586623,"#B37263"],[0.56387605237916372,"#B37263"],[0.56399630680499868,"#B37263"],[0.56422322012225412,"#B37263"],[0.56439099437840556,"#B37263"],[0.56443560089027467,"#B37263"],[0.56444319369329188,"#B37263"],[0.56451299748215433,"#B37263"],[0.56463342784123061,"#B37263"],[0.56481668112736683,"#B37263"],[0.56498534233087605,"#B37263"],[0.56513620117807428,"#B27263"],[0.56513939447308814,"#B27263"],[0.56524880667409549,"#B27163"],[0.56527882202296387,"#B27163"],[0.56540361090488389,"#B27163"],[0.56547730098806448,"#B27163"],[0.56551374850572378,"#B27163"],[0.56560922368120736,"#B27163"],[0.56569002676152891,"#B27163"],[0.56574560430554455,"#B27163"],[0.56575614955624098,"#B27163"],[0.56580758535839881,"#B27163"],[0.56584432894795822,"#B27163"],[0.56586637659442274,"#B27163"],[0.56587372605873698,"#B27163"],[0.56609360812702492,"#B27162"],[0.56634114868443053,"#B27162"],[0.56649915469125434,"#B27162"],[0.56678560967042824,"#B27162"],[0.56692277714132322,"#B27162"],[0.56692532259619255,"#B27162"],[0.5674904335348282,"#B27162"],[0.56750866794762334,"#B27162"],[0.56774387453864583,"#B27162"],[0.56794346145088481,"#B27162"],[0.56804406278063513,"#B27162"],[0.56850575414295101,"#B27162"],[0.56854918903822371,"#B27162"],[0.56858361087634712,"#B27162"],[0.56908961545615344,"#B27162"],[0.5691090249260442,"#B27162"],[0.56934119183447685,"#B27162"],[0.56949032693177526,"#B27162"],[0.569620253164557,"#B27062"],[0.57011724498142791,"#B27062"],[0.57011980935173867,"#B27062"],[0.57022397809711323,"#B27061"],[0.57046230026557798,"#B27061"],[0.57059995094453297,"#B27061"],[0.57088496872833239,"#B27061"],[0.57106832282334352,"#B27061"],[0.57134645576190835,"#B27061"],[0.57142158842140778,"#B27061"],[0.57152231361180128,"#B27061"],[0.57163659784588827,"#B27061"],[0.57196187755078409,"#B17061"],[0.57236810603092048,"#B17061"],[0.57237462535875117,"#B17061"],[0.57238697015013862,"#B17061"],[0.57245695484156589,"#B17061"],[0.57279754821025541,"#B17061"],[0.57309898072345422,"#B17061"],[0.57319356984316427,"#B17061"],[0.57330176810983025,"#B17061"],[0.573555381756226,"#B17061"],[0.57357499449312677,"#B17061"],[0.57380959422823563,"#B17061"],[0.57394178295670217,"#B16F61"],[0.57422249008775206,"#B16F61"],[0.57429389740226511,"#B16F61"],[0.57450639702257478,"#B16F60"],[0.57463130138895435,"#B16F60"],[0.5746416429819774,"#B16F60"],[0.57495395988502829,"#B16F60"],[0.57513018783842296,"#B16F60"],[0.5751893211467225,"#B16F60"],[0.57526183928560892,"#B16F60"],[0.57555490742979276,"#B16F60"],[0.5757156450782952,"#B16F60"],[0.57583313361710831,"#B16F60"],[0.57585829956120038,"#B16F60"],[0.5760247777102826,"#B16F60"],[0.57609648862330221,"#B16F60"],[0.57634494471543429,"#B16F60"],[0.57651326617624421,"#B16F60"],[0.57657847566626352,"#B16F60"],[0.57677729471607386,"#B16F60"],[0.57679705676790993,"#B16F60"],[0.57690617655739884,"#B16F60"],[0.57700066484477242,"#B16F60"],[0.57715415588116414,"#B16F60"],[0.57718927826569066,"#B16F60"],[0.57736287695533328,"#B16F60"],[0.57752144240480074,"#B16F60"],[0.57766495768142856,"#B16F60"],[0.57775612582999258,"#B16F60"],[0.57777430177071776,"#B16F60"],[0.57778090457359554,"#B16F60"],[0.57779340743777907,"#B16F60"],[0.5778264987062488,"#B16F60"],[0.57790677791981193,"#B16F60"],[0.57800505697422033,"#B16F60"],[0.57808823405492804,"#B16F60"],[0.57815630022873465,"#B16F60"],[0.57820924818010555,"#B16E60"],[0.5782470722150983,"#B16E60"],[0.57826976826442333,"#B16E60"],[0.5782773338856303,"#B16E60"],[0.57839344918861402,"#B06E60"],[0.57862907130962049,"#B06E60"],[0.57886316402899751,"#B06E5F"],[0.57894414409900719,"#B06E5F"],[0.57899172772768648,"#B06E5F"],[0.57947040373376446,"#B06E5F"],[0.5795756792874307,"#B06E5F"],[0.57988719786351273,"#B06E5F"],[0.58012032581559714,"#B06E5F"],[0.5801452440881556,"#B06E5F"],[0.58029821823519101,"#B06E5F"],[0.58070036350215426,"#B06E5F"],[0.58089850761833617,"#B06E5F"],[0.58111243467067453,"#B06E5F"],[0.58124098008171932,"#B06E5F"],[0.58128457123226851,"#B06E5F"],[0.58176703758685577,"#B06E5F"],[0.58189700096224339,"#B06E5F"],[0.58191297359429273,"#B06E5F"],[0.58227848101265822,"#B06E5F"],[0.58243678050700853,"#B06E5F"],[0.58269975629019166,"#B06D5F"],[0.58277525661632679,"#B06D5F"],[0.58288258585566455,"#B06D5F"],[0.58325731194379193,"#B06D5E"],[0.58347270480552371,"#B06D5E"],[0.58357685373070178,"#B06D5E"],[0.58372459585591874,"#B06D5E"],[0.58385517058263237,"#B06D5E"],[0.58417705855426338,"#B06D5E"],[0.58423174198353056,"#B06D5E"],[0.58461465160635129,"#B06D5E"],[0.58470469095527622,"#B06D5E"],[0.58481466378323876,"#B06D5E"],[0.58497679149674675,"#AF6D5E"],[0.58503732797045038,"#AF6D5E"],[0.58544504201981096,"#AF6D5E"],[0.58570777788029593,"#AF6D5E"],[0.58576097448658659,"#AF6D5E"],[0.5858201922225732,"#AF6D5E"],[0.58583774956634294,"#AF6D5E"],[0.58621540788370519,"#AF6D5E"],[0.58642462656525129,"#AF6D5E"],[0.58657797572977843,"#AF6D5E"],[0.58669401214422057,"#AF6D5E"],[0.58692325759394093,"#AF6C5E"],[0.58692541336849458,"#AF6C5E"],[0.58712726391203351,"#AF6C5E"],[0.58725768259099886,"#AF6C5D"],[0.58757474673611654,"#AF6C5D"],[0.58761368666401737,"#AF6C5D"],[0.5878156172438147,"#AF6C5D"],[0.58787657071010102,"#AF6C5D"],[0.5880137871805422,"#AF6C5D"],[0.5881631210056385,"#AF6C5D"],[0.58843436572008523,"#AF6C5D"],[0.58848961487989926,"#AF6C5D"],[0.58851990844451918,"#AF6C5D"],[0.58864520236927043,"#AF6C5D"],[0.58869027457291634,"#AF6C5D"],[0.58893081892236254,"#AF6C5D"],[0.58909168117437738,"#AF6C5D"],[0.58914918616905254,"#AF6C5D"],[0.58915597178121448,"#AF6C5D"],[0.58936570783177511,"#AF6C5D"],[0.58941258840968735,"#AF6C5D"],[0.58956000343993997,"#AF6C5D"],[0.58973883666838844,"#AF6C5D"],[0.58979426152274239,"#AF6C5D"],[0.58986476126984777,"#AF6C5D"],[0.58990218728886812,"#AF6C5D"],[0.59005003679355694,"#AF6C5D"],[0.59015683988000767,"#AF6C5D"],[0.59018236840548743,"#AF6C5D"],[0.59029163804405838,"#AF6C5D"],[0.59029916708802088,"#AF6C5D"],[0.59040041955335765,"#AF6C5D"],[0.59042477244826586,"#AF6C5D"],[0.59048611427007314,"#AF6C5D"],[0.59055624146966912,"#AF6C5D"],[0.59061079315213205,"#AF6C5D"],[0.59064976309049122,"#AF6C5D"],[0.59067314683436944,"#AF6C5D"],[0.5906809417125235,"#AF6C5D"],[0.59104065158172558,"#AF6C5D"],[0.59107235230065247,"#AF6C5D"],[0.59115696942827678,"#AF6C5D"],[0.59120916374697696,"#AF6B5D"],[0.59164183272082527,"#AE6B5C"],[0.59200849527498334,"#AE6B5C"],[0.59222825085744901,"#AE6B5C"],[0.59224855340291893,"#AE6B5C"],[0.59226786912500184,"#AE6B5C"],[0.59279984220999293,"#AE6B5C"],[0.59284612896503397,"#AE6B5C"],[0.59327490968734065,"#AE6B5C"],[0.59335654425541284,"#AE6B5C"],[0.59345120522491568,"#AE6B5C"],[0.59366978458402264,"#AE6B5C"],[0.59389829576095643,"#AE6B5C"],[0.59428813368607059,"#AE6B5C"],[0.59442503681554348,"#AE6B5C"],[0.59447937695908326,"#AE6B5C"],[0.59462225393030921,"#AE6B5C"],[0.59493670886075956,"#AE6B5C"],[0.59527482169593859,"#AE6B5C"],[0.59528812676635678,"#AE6B5C"],[0.59543325472143038,"#AE6B5C"],[0.59578090844905152,"#AE6A5B"],[0.59591461863574025,"#AE6A5B"],[0.59605603521617323,"#AE6A5B"],[0.59627479061260047,"#AE6A5B"],[0.59638074628486137,"#AE6A5B"],[0.59682293479469506,"#AE6A5B"],[0.59683158482205734,"#AE6A5B"],[0.59692706189788991,"#AE6A5B"],[0.59724802726271242,"#AE6A5B"],[0.5972670829012301,"#AE6A5B"],[0.59757543859735629,"#AE6A5B"],[0.59768719070487275,"#AE6A5B"],[0.59806060733423605,"#AE6A5B"],[0.59809185997139558,"#AE6A5B"],[0.59820773914506975,"#AD6A5B"],[0.59831346571870281,"#AD6A5B"],[0.59848104402179292,"#AD6A5B"],[0.59885469778561695,"#AD6A5B"],[0.59903693621981646,"#AD6A5B"],[0.59915382911605874,"#AD6A5B"],[0.59918143778881583,"#AD6A5B"],[0.59921277782622595,"#AD6A5B"],[0.59944619741190008,"#AD6A5B"],[0.5995552423652748,"#AD6A5B"],[0.59974577116621808,"#AD6A5B"],[0.59988205130641847,"#AD695B"],[0.60008620049818051,"#AD695A"],[0.60019316625819497,"#AD695A"],[0.60028944629917402,"#AD695A"],[0.60043989266579478,"#AD695A"],[0.60048855055606043,"#AD695A"],[0.60069874370069032,"#AD695A"],[0.60076816928354815,"#AD695A"],[0.60100475711870027,"#AD695A"],[0.60103198929251977,"#AD695A"],[0.6011192239067169,"#AD695A"],[0.60127997922248677,"#AD695A"],[0.60138452594403335,"#AD695A"],[0.6015121095189726,"#AD695A"],[0.60172835245089296,"#AD695A"],[0.60178368919530656,"#AD695A"],[0.60190940334881637,"#AD695A"],[0.60192868212692952,"#AD695A"],[0.60193920026346515,"#AD695A"],[0.60211307451087526,"#AD695A"],[0.60228150743593067,"#AD695A"],[0.60243321399382121,"#AD695A"],[0.60243396061793064,"#AD695A"],[0.60246656987849778,"#AD695A"],[0.60257041566748359,"#AD695A"],[0.60269085610100714,"#AD695A"],[0.60279526735064382,"#AD695A"],[0.60280004414332367,"#AD695A"],[0.60288363677304269,"#AD695A"],[0.60295595365699661,"#AD695A"],[0.60301220922992171,"#AD695A"],[0.60305239666317167,"#AD695A"],[0.603067724958114,"#AD695A"],[0.60307651107617888,"#AD695A"],[0.60308454953941681,"#AD695A"],[0.60316745372659442,"#AD695A"],[0.60353547137009378,"#AD695A"],[0.60367658508074751,"#AD695A"],[0.60368714997513084,"#AD695A"],[0.60429141820020704,"#AD6859"],[0.60438339043078382,"#AD6859"],[0.60453893240391865,"#AD6859"],[0.60459112383563984,"#AD6859"],[0.60488046009411955,"#AC6859"],[0.60538699306096222,"#AC6859"],[0.60545420745985901,"#AC6859"],[0.60558689646195729,"#AC6859"],[0.60563342087893268,"#AC6859"],[0.60601259347907643,"#AC6859"],[0.60622067474667007,"#AC6859"],[0.60655555274816608,"#AC6859"],[0.60666225632923809,"#AC6859"],[0.60677785768316395,"#AC6859"],[0.60703988594422353,"#AC6859"],[0.60708302131394087,"#AC6859"],[0.60759493670886067,"#AC6859"],[0.6076775242805722,"#AC6859"],[0.60784453596723664,"#AC6859"],[0.60795615976751338,"#AC6859"],[0.60809123798576903,"#AC6859"],[0.60857186575209821,"#AC6758"],[0.60863453500208109,"#AC6758"],[0.60867911913175621,"#AC6758"],[0.60903676220350089,"#AC6758"],[0.60912168823214152,"#AC6758"],[0.6094097941504617,"#AC6758"],[0.60948587115686514,"#AC6758"],[0.60966693562722918,"#AC6758"],[0.60991913808267229,"#AC6758"],[0.61015178982583307,"#AC6758"],[0.61017022547220134,"#AC6758"],[0.61027432847320795,"#AC6758"],[0.61033651013665613,"#AC6758"],[0.61064086889859737,"#AC6758"],[0.61073793619072325,"#AC6758"],[0.61091574202820009,"#AC6758"],[0.61112336686309288,"#AC6758"],[0.6114139658019232,"#AB6758"],[0.61143884459403053,"#AB6758"],[0.61149275454761709,"#AB6758"],[0.61160081450690074,"#AB6758"],[0.61164625792352667,"#AB6758"],[0.61184605344224363,"#AB6758"],[0.61218321957657973,"#AB6758"],[0.61236168835060167,"#AB6758"],[0.61250421083852369,"#AB6758"],[0.61254048548160411,"#AB6758"],[0.61254666848557271,"#AB6758"],[0.61271369957729638,"#AB6758"],[0.61280898699992359,"#AB6757"],[0.61306194963243232,"#AB6657"],[0.61309750974123001,"#AB6657"],[0.61336974267510835,"#AB6657"],[0.61347832738406927,"#AB6657"],[0.6136256513689754,"#AB6657"],[0.61365377276575439,"#AB6657"],[0.61374695926585288,"#AB6657"],[0.61386520336643158,"#AB6657"],[0.61397623390515266,"#AB6657"],[0.61408836820755441,"#AB6657"],[0.61429511744802734,"#AB6657"],[0.61439568831214175,"#AB6657"],[0.61441663596472762,"#AB6657"],[0.61448542467707368,"#AB6657"],[0.61465926553417227,"#AB6657"],[0.61475371293716308,"#AB6657"],[0.61481661772452711,"#AB6657"],[0.61495746103327131,"#AB6657"],[0.61507089970307249,"#AB6657"],[0.61508177733838254,"#AB6657"],[0.61518955062229086,"#AB6657"],[0.61522632629654028,"#AB6657"],[0.61528076698216316,"#AB6657"],[0.61529864898472308,"#AB6657"],[0.61535541463884758,"#AB6657"],[0.6154134839444636,"#AB6657"],[0.61545496738862959,"#AB6657"],[0.61547985960331453,"#AB6657"],[0.61548815736631002,"#AB6657"],[0.6157096717580457,"#AB6657"],[0.61584019134801427,"#AB6657"],[0.61618710776739949,"#AB6657"],[0.61633287475276444,"#AB6657"],[0.6164638550922148,"#AB6657"],[0.61691309346099921,"#AB6657"],[0.61694043269889587,"#AB6657"],[0.61706096372243469,"#AB6656"],[0.61753227103897701,"#AB6556"],[0.61768869828834916,"#AB6556"],[0.61792011665531343,"#AA6556"],[0.61797230489142019,"#AA6556"],[0.61810831668841226,"#AA6556"],[0.61866849807709867,"#AA6556"],[0.61876446716176858,"#AA6556"],[0.61890073357135622,"#AA6556"],[0.61901771145027085,"#AA6556"],[0.61921274519063074,"#AA6556"],[0.61959391667525432,"#AA6556"],[0.61974098961103175,"#AA6556"],[0.62004919918828139,"#AA6556"],[0.62009983835393534,"#AA6556"],[0.62025316455696211,"#AA6556"],[0.62040836751482697,"#AA6556"],[0.62074920492335417,"#AA6556"],[0.62075390027257638,"#AA6556"],[0.62106665444090869,"#AA6556"],[0.62120772293339177,"#AA6556"],[0.62122904732042017,"#AA6556"],[0.62128588981234956,"#AA6556"],[0.62169263011198539,"#AA6455"],[0.62199188716627285,"#AA6455"],[0.62206996387425462,"#AA6455"],[0.62207705987478934,"#AA6455"],[0.62213989345309306,"#AA6455"],[0.62245876492493724,"#AA6455"],[0.62257077932683214,"#AA6455"],[0.62276076548006376,"#AA6455"],[0.62298523158033725,"#AA6455"],[0.62305901453188861,"#AA6455"],[0.62338319595991043,"#AA6455"],[0.62338792414798194,"#AA6455"],[0.62351426422170864,"#AA6455"],[0.62361834051186027,"#AA6455"],[0.62376462014521727,"#AA6455"],[0.62403369388255447,"#AA6455"],[0.6241294537825075,"#AA6455"],[0.6242522908677719,"#AA6455"],[0.62447764851681331,"#A96455"],[0.62468636425982194,"#A96455"],[0.62476449327608907,"#A96455"],[0.62480915802308035,"#A96455"],[0.6249747540738414,"#A96455"],[0.62499388986873183,"#A96455"],[0.6251239380361826,"#A96455"],[0.62542194637978032,"#A96455"],[0.62568156372401829,"#A96454"],[0.62570314299397789,"#A96454"],[0.62589709984562192,"#A96454"],[0.62593949095602863,"#A96454"],[0.62596748996173734,"#A96454"],[0.62597225081858165,"#A96454"],[0.62621495153401097,"#A96354"],[0.6263726309804396,"#A96354"],[0.62644549415355377,"#A96354"],[0.62665908647737845,"#A96354"],[0.62685569939781904,"#A96354"],[0.62687038618337021,"#A96354"],[0.62701603681693607,"#A96354"],[0.62703530606217139,"#A96354"],[0.62704786833277992,"#A96354"],[0.62719788189087811,"#A96354"],[0.6272454539067468,"#A96354"],[0.62734340459423066,"#A96354"],[0.62747185418756191,"#A96354"],[0.62758321300490616,"#A96354"],[0.62767746571110261,"#A96354"],[0.62770718964767758,"#A96354"],[0.62775459931232525,"#A96354"],[0.62778646521395576,"#A96354"],[0.62781460316502224,"#A96354"],[0.62785746898324768,"#A96354"],[0.62788319084437849,"#A96354"],[0.62789176519320322,"#A96354"],[0.62812118079966428,"#A96354"],[0.62835051021802912,"#A96354"],[0.62850584311604774,"#A96354"],[0.62868761838694565,"#A96354"],[0.62897774681209406,"#A96354"],[0.62921240846248794,"#A96354"],[0.6295737367698433,"#A96354"],[0.62958881772235342,"#A96354"],[0.62975328758392468,"#A96354"],[0.63018364281405903,"#A96353"],[0.63028959658023698,"#A96353"],[0.63044471221153087,"#A96253"],[0.63076214357341809,"#A96253"],[0.63098765603144435,"#A86253"],[0.63124360301796634,"#A86253"],[0.6313004373959179,"#A86253"],[0.63132424315534807,"#A86253"],[0.6313526220821839,"#A86253"],[0.63186986643074305,"#A86253"],[0.63214080589615995,"#A86253"],[0.63220881680267893,"#A86253"],[0.63239894003318886,"#A86253"],[0.63240136210151632,"#A86253"],[0.63260453890992108,"#A86253"],[0.63291139240506333,"#A86253"],[0.63296571222939657,"#A86253"],[0.63340715384296176,"#A86253"],[0.63341663790555724,"#A86253"],[0.63343569402597033,"#A86253"],[0.63377505191196515,"#A86253"],[0.63388615654238301,"#A86253"],[0.63395310159178453,"#A86253"],[0.63434833464161366,"#A86252"],[0.63445549554960379,"#A86252"],[0.63456872151503574,"#A86252"],[0.63461098705419794,"#A86252"],[0.6347936242647505,"#A86152"],[0.6352219635637949,"#A86152"],[0.63528915380918649,"#A86152"],[0.63534661872061371,"#A86152"],[0.6354606447256872,"#A86152"],[0.63563329275976299,"#A86152"],[0.6357917317127304,"#A86152"],[0.63602755418274581,"#A86152"],[0.63610864237785814,"#A86152"],[0.63640469231086372,"#A86152"],[0.6364510200206861,"#A86152"],[0.63661255757191304,"#A86152"],[0.63676465380805336,"#A86152"],[0.63685469255965343,"#A86152"],[0.63695873914060652,"#A86152"],[0.63710738756062946,"#A86152"],[0.6374265003693047,"#A76152"],[0.63743284471256734,"#A76152"],[0.63758467061937873,"#A76152"],[0.63774097869944835,"#A76152"],[0.63792317418827338,"#A76152"],[0.63803174528101514,"#A76152"],[0.63811187643940737,"#A76152"],[0.63829847924781025,"#A76152"],[0.63830510257228612,"#A76152"],[0.63838696523056282,"#A76152"],[0.63856101107317831,"#A76152"],[0.63879943369659009,"#A76151"],[0.63899602253009524,"#A76151"],[0.63902033579489959,"#A76151"],[0.63922086430112568,"#A76051"],[0.63922368518483341,"#A76051"],[0.63925101060114176,"#A76051"],[0.6393322946448674,"#A76051"],[0.63940945217066558,"#A76051"],[0.6395776095657083,"#A76051"],[0.63967720600273104,"#A76051"],[0.63972813271205775,"#A76051"],[0.63986099949856245,"#A76051"],[0.63997619037698295,"#A76051"],[0.64007368837631695,"#A76051"],[0.64015347911526388,"#A76051"],[0.64021555081280779,"#A76051"],[0.64025989429690233,"#A76051"],[0.64026236929204461,"#A76051"],[0.64028650301124002,"#A76051"],[0.64029537302009643,"#A76051"],[0.64034193671048145,"#A76051"],[0.640376008558035,"#A76051"],[0.64050548792558704,"#A76051"],[0.6409901232631634,"#A76051"],[0.64117707055028916,"#A76051"],[0.64148673723380112,"#A76051"],[0.64161102772807543,"#A76051"],[0.64162167589223262,"#A76051"],[0.6417769044884517,"#A76051"],[0.64207628055599175,"#A76051"],[0.64223650650709563,"#A76051"],[0.64258306359638917,"#A76051"],[0.64283452875107705,"#A76051"],[0.64295988226439271,"#A76051"],[0.64301148483382997,"#A76050"],[0.64303497286933886,"#A76050"],[0.64341565805696832,"#A76050"],[0.64366485471219348,"#A75F50"],[0.64382775951101756,"#A65F50"],[0.64397981170207919,"#A65F50"],[0.64427955144358995,"#A65F50"],[0.64439951214146307,"#A65F50"],[0.64452690886272257,"#A65F50"],[0.64467979707383793,"#A65F50"],[0.64473197780171143,"#A65F50"],[0.64505687066804995,"#A65F50"],[0.64551049812693218,"#A65F50"],[0.645515880736106,"#A65F50"],[0.64556962025316467,"#A65F50"],[0.64577496353282093,"#A65F50"],[0.64578430029663081,"#A65F50"],[0.64606508281143471,"#A65F50"],[0.64633589734980124,"#A65F50"],[0.64654318564592739,"#A65F50"],[0.64672767042192503,"#A65F50"],[0.64682168989832745,"#A65F50"],[0.64700385821988893,"#A65F50"],[0.64713769194573734,"#A65F50"],[0.64713973489962862,"#A65F50"],[0.64744703220619271,"#A65F4F"],[0.64784401463774421,"#A65E4F"],[0.64787264153567869,"#A65E4F"],[0.64792728256750654,"#A65E4F"],[0.64793092546620001,"#A65E4F"],[0.64828062244430995,"#A65E4F"],[0.64848754940848763,"#A65E4F"],[0.64867091351906869,"#A65E4F"],[0.64869843079747191,"#A65E4F"],[0.64885114293662949,"#A65E4F"],[0.64904345574252154,"#A65E4F"],[0.64912012008250608,"#A65E4F"],[0.64939819253597775,"#A65E4F"],[0.64945307136093888,"#A65E4F"],[0.64973506980117268,"#A65E4F"],[0.64982438707616752,"#A65E4F"],[0.64984294367009565,"#A65E4F"],[0.6500540359604049,"#A65E4F"],[0.65019109742223313,"#A65E4F"],[0.65029511083056657,"#A55E4F"],[0.65035504199506045,"#A55E4F"],[0.65063804148245841,"#A55E4F"],[0.65081928623047025,"#A55E4F"],[0.65090299063095491,"#A55E4F"],[0.65091240360432978,"#A55E4F"],[0.6511480552690363,"#A55E4F"],[0.65114984831324496,"#A55E4F"],[0.65137857609780336,"#A55E4F"],[0.6514557540607524,"#A55E4F"],[0.65158913827841092,"#A55E4F"],[0.65161688605471535,"#A55E4F"],[0.65178004059239369,"#A55E4E"],[0.6517815019017118,"#A55E4E"],[0.65184525056904941,"#A55E4E"],[0.65195563679275448,"#A55E4E"],[0.65211151557847069,"#A55E4E"],[0.65224911370904815,"#A55D4E"],[0.65230444251129382,"#A55D4E"],[0.65236840947716146,"#A55D4E"],[0.65245840351285866,"#A55D4E"],[0.65246938403502264,"#A55D4E"],[0.65255202140922319,"#A55D4E"],[0.65260190596957246,"#A55D4E"],[0.65261630851333952,"#A55D4E"],[0.65266223515827715,"#A55D4E"],[0.65268979406033756,"#A55D4E"],[0.65269898084698974,"#A55D4E"],[0.65272507737912644,"#A55D4E"],[0.65297497236825497,"#A55D4E"],[0.65328704370077473,"#A55D4E"],[0.65362837674181962,"#A55D4E"],[0.65365426793001369,"#A55D4E"],[0.65373342265697809,"#A55D4E"],[0.65375528058127919,"#A55D4E"],[0.65426455853577536,"#A55D4E"],[0.65456748436906254,"#A55D4E"],[0.65471637590173615,"#A55D4E"],[0.6548501601854777,"#A55D4E"],[0.65488342250671305,"#A55D4E"],[0.65503853454026395,"#A55D4E"],[0.65546459967457171,"#A55D4E"],[0.65548487532887645,"#A55D4E"],[0.65595197464105115,"#A55D4E"],[0.6560688256585312,"#A55D4E"],[0.65613309178495227,"#A55D4D"],[0.65630801279463791,"#A55D4D"],[0.65634548774975965,"#A55D4D"],[0.65663518419776035,"#A45C4D"],[0.65703872219584958,"#A45C4D"],[0.65718386375759341,"#A45C4D"],[0.65721002349432656,"#A45C4D"],[0.65753703477517011,"#A45C4D"],[0.65756356213674483,"#A45C4D"],[0.65771477932037326,"#A45C4D"],[0.65805808287688394,"#A45C4D"],[0.65811025917266619,"#A45C4D"],[0.65822784810126589,"#A45C4D"],[0.65872298960881626,"#A45C4D"],[0.65880502879725578,"#A45C4D"],[0.65888954300818348,"#A45C4D"],[0.65892804714246556,"#A45C4D"],[0.65916644211115383,"#A45C4D"],[0.65920012570445519,"#A45C4D"],[0.65965918066086138,"#A45C4D"],[0.65970428221506816,"#A45C4D"],[0.66003225849814795,"#A45C4D"],[0.6601000812190807,"#A45C4D"],[0.66020712783576574,"#A45C4D"],[0.6603059700380598,"#A45C4D"],[0.66050218011507011,"#A45C4C"],[0.66052275664431215,"#A45C4C"],[0.66092713878026088,"#A45B4C"],[0.66123217352538921,"#A45B4C"],[0.66124509650787222,"#A45B4C"],[0.66128311769157322,"#A45B4C"],[0.66131316210197033,"#A45B4C"],[0.6616706435324049,"#A45B4C"],[0.66168076376703899,"#A45B4C"],[0.66193417411578481,"#A45B4C"],[0.66202988366513194,"#A45B4C"],[0.66204697736945273,"#A45B4C"],[0.66224143678463676,"#A45B4C"],[0.66236046446570207,"#A45B4C"],[0.66244338769872435,"#A45B4C"],[0.66267245166383049,"#A45B4C"],[0.66279364309110667,"#A45B4C"],[0.66296579362410801,"#A45B4C"],[0.66302190665559191,"#A35B4C"],[0.66323477571675671,"#A35B4C"],[0.66324044162247442,"#A35B4C"],[0.66341918185197035,"#A35B4C"],[0.66349634988593831,"#A35B4C"],[0.66352300039278345,"#A35B4C"],[0.66362697660643355,"#A35B4C"],[0.66373347563010388,"#A35B4C"],[0.66395177909443548,"#A35B4C"],[0.66415122357518941,"#A35B4C"],[0.66421204899811848,"#A35B4C"],[0.66423493648111065,"#A35B4C"],[0.66433177545595423,"#A35B4C"],[0.66435959744013173,"#A35B4C"],[0.66449340423573855,"#A35B4C"],[0.66463608255455187,"#A35B4C"],[0.6647597862164305,"#A35B4C"],[0.66479570749197436,"#A35B4C"],[0.66486449420986227,"#A35B4B"],[0.66489172772090543,"#A35B4B"],[0.6649293403097265,"#A35B4B"],[0.6649501887255691,"#A35B4B"],[0.66501685517161579,"#A35B4B"],[0.66506448218581116,"#A35B4B"],[0.66509306164537962,"#A35B4B"],[0.66510258867388283,"#A35B4B"],[0.6651731159542249,"#A35B4B"],[0.66560610265591202,"#A35A4B"],[0.66568355296616,"#A35A4B"],[0.66594942440560678,"#A35A4B"],[0.66611783663719604,"#A35A4B"],[0.66626511619711692,"#A35A4B"],[0.6663516467224444,"#A35A4B"],[0.66690627558727322,"#A35A4B"],[0.66699360940910979,"#A35A4B"],[0.66704607190466825,"#A35A4B"],[0.66708797125314478,"#A35A4B"],[0.66752947753278724,"#A35A4B"],[0.66779877238331653,"#A35A4B"],[0.66795768350004114,"#A35A4B"],[0.66813462086809439,"#A35A4B"],[0.66821119186444722,"#A35A4B"],[0.66828960208990018,"#A35A4B"],[0.66872160663066538,"#A35A4B"],[0.6688525341340078,"#A35A4B"],[0.6692329367885903,"#A35A4A"],[0.66929033813534589,"#A35A4A"],[0.6693189300641228,"#A35A4A"],[0.66957136552767826,"#A25A4A"],[0.6697304875672897,"#A2594A"],[0.66984072104791248,"#A2594A"],[0.67037266345772695,"#A2594A"],[0.67041102974443367,"#A2594A"],[0.67059140869449974,"#A2594A"],[0.67065397061565779,"#A2594A"],[0.67083873349515777,"#A2594A"],[0.67088607594936711,"#A2594A"],[0.67138087167311655,"#A2594A"],[0.67143516362904843,"#A2594A"],[0.67148733494037893,"#A2594A"],[0.67185696641419024,"#A2594A"],[0.67186439589024816,"#A2594A"],[0.6720617031708167,"#A2594A"],[0.67209153907658536,"#A2594A"],[0.67226161978900234,"#A2594A"],[0.67231427866057836,"#A2594A"],[0.67254768990693159,"#A2594A"],[0.67275272966938515,"#A2594A"],[0.6730706459838014,"#A2594A"],[0.67317224353154748,"#A2594A"],[0.67332961472836961,"#A2594A"],[0.67339455118003266,"#A2594A"],[0.67345596242852457,"#A2594A"],[0.67357274723481209,"#A2594A"],[0.6735919391983991,"#A2594A"],[0.67386211250173433,"#A25949"],[0.67395417072485697,"#A25949"],[0.67431644696444093,"#A25849"],[0.67455279234239773,"#A25849"],[0.67461992774987245,"#A25849"],[0.67463589119806688,"#A25849"],[0.67465951199047169,"#A25849"],[0.67483657507339645,"#A25849"],[0.67491227921747798,"#A25849"],[0.67498330496887948,"#A25849"],[0.6752877682471925,"#A25849"],[0.67539185558371606,"#A25849"],[0.67557284740470991,"#A25849"],[0.67563150096071745,"#A25849"],[0.67576090331206551,"#A25849"],[0.67583849130017226,"#A15849"],[0.67608465211683555,"#A15849"],[0.67612988091435167,"#A15849"],[0.67620336654501967,"#A15849"],[0.67631128540485586,"#A15849"],[0.67641740513661763,"#A15849"],[0.67651835012090089,"#A15849"],[0.67662650478006392,"#A15849"],[0.67670580866490426,"#A15849"],[0.67684984427980965,"#A15849"],[0.67687362691388819,"#A15849"],[0.676953778601038,"#A15849"],[0.67702177425278509,"#A15849"],[0.67715022360219157,"#A15849"],[0.67725895144299808,"#A15849"],[0.67734793783784153,"#A15849"],[0.67741716644933536,"#A15849"],[0.6774666245550387,"#A15849"],[0.67749630305913211,"#A15849"],[0.67750619650077604,"#A15849"],[0.67755162469369357,"#A15849"],[0.67755616108565353,"#A15849"],[0.67760478579423489,"#A15849"],[0.67790975226851891,"#A15849"],[0.67813124881475573,"#A15848"],[0.67823510318303493,"#A15848"],[0.67856619131605578,"#A15748"],[0.67889478179088203,"#A15748"],[0.67890016287788335,"#A15748"],[0.67929314427469378,"#A15748"],[0.67938914216889668,"#A15748"],[0.67951056947597488,"#A15748"],[0.67954668910069027,"#A15748"],[0.6801745694553486,"#A15748"],[0.68021905066328336,"#A15748"],[0.68043776931492128,"#A15748"],[0.68043929509537904,"#A15748"],[0.68078369391574656,"#A15748"],[0.6808553946485586,"#A15748"],[0.68134764087881716,"#A15748"],[0.68137395491369179,"#A15748"],[0.68152878866917921,"#A15748"],[0.68156953126416087,"#A15748"],[0.68162106584697901,"#A15748"],[0.68194524742605944,"#A15748"],[0.68224003531465893,"#A05748"],[0.68230832780678563,"#A05748"],[0.68249746906101483,"#A05747"],[0.68268368272372681,"#A05747"],[0.68282381579852025,"#A05647"],[0.68303052014316268,"#A05647"],[0.68311480496806842,"#A05647"],[0.68319834244935806,"#A05647"],[0.68354430379746844,"#A05647"],[0.6837477580677469,"#A05647"],[0.68378157945734919,"#A05647"],[0.68397180348221531,"#A05647"],[0.68403872603180293,"#A05647"],[0.68410395112796363,"#A05647"],[0.68451369581795585,"#A05647"],[0.68476326795324605,"#A05647"],[0.68481088589799943,"#A05647"],[0.68486305157683702,"#A05647"],[0.68496912517096553,"#A05647"],[0.68517350022005108,"#A05647"],[0.68536901288719343,"#A05647"],[0.68540492922661622,"#A05647"],[0.68563190875537883,"#A05647"],[0.68582102631694775,"#A05647"],[0.68592792941316805,"#A05647"],[0.6862173380436325,"#A05647"],[0.68631565750509371,"#A05647"],[0.68643473019571943,"#A05647"],[0.68658536745953591,"#A05647"],[0.68659378934907167,"#A05647"],[0.68661881852852713,"#A05647"],[0.68695030858506456,"#A05646"],[0.68697604360976028,"#A05646"],[0.68721921006503917,"#A05546"],[0.6872868275789128,"#A05546"],[0.68760328169681872,"#A05546"],[0.68785318479985147,"#A05546"],[0.68785532406964123,"#A05546"],[0.68789960990444776,"#A05546"],[0.68798317143539156,"#A05546"],[0.68798521001800705,"#A05546"],[0.68800722521833979,"#A05546"],[0.68817575482452176,"#A05546"],[0.68843166279132317,"#A05546"],[0.68866728390198872,"#9F5546"],[0.68873259362256012,"#9F5546"],[0.688882572064482,"#9F5546"],[0.68902130579735399,"#9F5546"],[0.68907192782092319,"#9F5546"],[0.68907748504213839,"#9F5546"],[0.68925198449468195,"#9F5546"],[0.68936672229971796,"#9F5546"],[0.68938207845145527,"#9F5546"],[0.68940603601562511,"#9F5546"],[0.68946122646498442,"#9F5546"],[0.6895396091659628,"#9F5546"],[0.68965267750408854,"#9F5546"],[0.68974521861186155,"#9F5546"],[0.68981721411676622,"#9F5546"],[0.68986864971011297,"#9F5546"],[0.68989951516123793,"#9F5546"],[0.68990980432766935,"#9F5546"],[0.69001811751286479,"#9F5546"],[0.69017097625531076,"#9F5546"],[0.69027486316306053,"#9F5546"],[0.69073582876060957,"#9F5546"],[0.69086171293286092,"#9F5546"],[0.69089572931958831,"#9F5546"],[0.690997493241858,"#9F5546"],[0.69118773386634658,"#9F5546"],[0.69146180593225293,"#9F5445"],[0.6915333087717821,"#9F5445"],[0.69195926667788688,"#9F5445"],[0.69209029813886092,"#9F5445"],[0.69218563848639758,"#9F5445"],[0.69239608323549795,"#9F5445"],[0.6926325708557024,"#9F5445"],[0.69281412755625804,"#9F5445"],[0.69281857933619939,"#9F5445"],[0.69290327243896432,"#9F5445"],[0.69342993642838135,"#9F5445"],[0.69343201123030285,"#9F5445"],[0.6937869723718062,"#9F5445"],[0.69382934617760816,"#9F5445"],[0.6938829446843604,"#9F5445"],[0.69402581683118147,"#9F5445"],[0.69442829444841325,"#9F5445"],[0.69459988165749464,"#9F5445"],[0.69473732469293437,"#9F5445"],[0.69475454836040684,"#9F5445"],[0.69492482472358175,"#9E5445"],[0.69515409418581808,"#9E5445"],[0.6953561161099141,"#9E5445"],[0.69562704604468351,"#9E5445"],[0.69568834595108919,"#9E5445"],[0.69603003975943534,"#9E5344"],[0.69604594205552739,"#9E5344"],[0.69606393747158868,"#9E5344"],[0.69620253164556956,"#9E5344"],[0.69649834966905755,"#9E5344"],[0.696696549216135,"#9E5344"],[0.69681539795296987,"#9E5344"],[0.69715013851390251,"#9E5344"],[0.69717029995969382,"#9E5344"],[0.69735107649623429,"#9E5344"],[0.69735790617603854,"#9E5344"],[0.69761916609371966,"#9E5344"],[0.69762368861654289,"#9E5344"],[0.69805662346146558,"#9E5344"],[0.69818506906941646,"#9E5344"],[0.69823722835040225,"#9E5344"],[0.69826058869372365,"#9E5344"],[0.69846901639237968,"#9E5344"],[0.69863625584139877,"#9E5344"],[0.69886078301634458,"#9E5344"],[0.69900017166526518,"#9E5344"],[0.69919547345605548,"#9E5344"],[0.69923184273274319,"#9E5344"],[0.69930702602919326,"#9E5344"],[0.69958211881345067,"#9E5344"],[0.69969148489800947,"#9E5344"],[0.69979623041555783,"#9E5344"],[0.69989878686900897,"#9E5344"],[0.6999115384798138,"#9E5344"],[0.70022003297626623,"#9E5243"],[0.7003593463372646,"#9E5243"],[0.70050753764040774,"#9E5243"],[0.70054618938634672,"#9E5243"],[0.70057309342989893,"#9E5243"],[0.70075875926761388,"#9E5243"],[0.70077399196938983,"#9E5243"],[0.70101933968244712,"#9E5243"],[0.70110788126762369,"#9D5243"],[0.7011452987782254,"#9D5243"],[0.70124352877942986,"#9D5243"],[0.70133061091930859,"#9D5243"],[0.70139400449803979,"#9D5243"],[0.70144651159519711,"#9D5243"],[0.70162824484973707,"#9D5243"],[0.70178868969389807,"#9D5243"],[0.7019278117506127,"#9D5243"],[0.70204558115151849,"#9D5243"],[0.70206863532050057,"#9D5243"],[0.702141972568882,"#9D5243"],[0.70221696524274746,"#9D5243"],[0.70222369267274076,"#9D5243"],[0.70227054300324321,"#9D5243"],[0.70230269428798919,"#9D5243"],[0.70230881838547621,"#9D5243"],[0.70231341215456256,"#9D5243"],[0.70237559029494578,"#9D5243"],[0.70241081628818547,"#9D5243"],[0.70250957069485831,"#9D5243"],[0.7027870214206543,"#9D5243"],[0.70340959815753701,"#9D5243"],[0.70348562648248159,"#9D5243"],[0.70358945944438811,"#9D5243"],[0.70384544312587893,"#9D5243"],[0.70388914878015529,"#9D5243"],[0.70389634432137083,"#9D5243"],[0.70416431036937344,"#9D5243"],[0.70439016735205584,"#9D5243"],[0.70478670364815854,"#9D5142"],[0.70482293567041399,"#9D5142"],[0.70526799160152098,"#9D5142"],[0.70535234203971786,"#9D5142"],[0.70536842329135041,"#9D5142"],[0.70546136782503566,"#9D5142"],[0.70554235329153725,"#9D5142"],[0.70596711982563498,"#9D5142"],[0.70607947524708758,"#9D5142"],[0.70629594143921759,"#9D5142"],[0.70662430037029955,"#9D5142"],[0.7066771294480807,"#9D5142"],[0.70687754620192478,"#9D5142"],[0.70713050449968839,"#9D5142"],[0.70718309869426443,"#9D5142"],[0.7072207859513695,"#9D5142"],[0.70725420515937254,"#9D5142"],[0.70781058045304635,"#9C5142"],[0.70796505691596867,"#9C5142"],[0.70812669729306488,"#9C5142"],[0.70827665390674732,"#9C5142"],[0.70834613686123959,"#9C5142"],[0.70837259673061093,"#9C5142"],[0.70881117438033092,"#9C5142"],[0.70886075949367089,"#9C5042"],[0.70901349863363639,"#9C5042"],[0.70929004605753032,"#9C5041"],[0.7093543371531178,"#9C5041"],[0.70940536411120303,"#9C5041"],[0.70967629679662747,"#9C5041"],[0.70982676244858989,"#9C5041"],[0.70985335734330623,"#9C5041"],[0.70988101473346932,"#9C5041"],[0.7102779319059509,"#9C5041"],[0.71042636665004644,"#9C5041"],[0.71051643112414231,"#9C5041"],[0.71059905122713507,"#9C5041"],[0.71070774607573617,"#9C5041"],[0.71072907208468328,"#9C5041"],[0.71111610963791905,"#9C5041"],[0.71131960814333506,"#9C5041"],[0.71140686571551903,"#9C5041"],[0.71150293150338073,"#9C5041"],[0.71155749905369814,"#9C5041"],[0.71160965102637941,"#9C5041"],[0.71186812491184281,"#9C5041"],[0.71189185455753234,"#9C5041"],[0.71202845871946518,"#9C5041"],[0.7122116075260263,"#9C5041"],[0.71236612602548255,"#9C5041"],[0.71253330152180649,"#9C5041"],[0.71268482009574941,"#9C5041"],[0.71277112692080169,"#9C5041"],[0.71283313367414158,"#9C5041"],[0.71311103543855769,"#9C5041"],[0.7131256300036144,"#9C5041"],[0.71315478554927592,"#9C5041"],[0.71316823697466147,"#9C5041"],[0.71336694302798631,"#9C4F41"],[0.7136007974847538,"#9C4F41"],[0.71361723073176619,"#9B4F40"],[0.71374173493860593,"#9B4F40"],[0.71381254474754052,"#9B4F40"],[0.71392331248555496,"#9B4F40"],[0.71400213571313131,"#9B4F40"],[0.71416952629279717,"#9B4F40"],[0.71420768920694,"#9B4F40"],[0.71431467746315713,"#9B4F40"],[0.714427978295471,"#9B4F40"],[0.71443755531138553,"#9B4F40"],[0.71453813107464192,"#9B4F40"],[0.7146163811736197,"#9B4F40"],[0.71467154415401346,"#9B4F40"],[0.71467228724011855,"#9B4F40"],[0.71470583613857064,"#9B4F40"],[0.71471701998145587,"#9B4F40"],[0.71478019262546133,"#9B4F40"],[0.71483237621397477,"#9B4F40"],[0.71519245977281387,"#9B4F40"],[0.71539932048230281,"#9B4F40"],[0.71562906833364659,"#9B4F40"],[0.71567085733104641,"#9B4F40"],[0.71579999083068147,"#9B4F40"],[0.71610648415527889,"#9B4F40"],[0.71652688726975355,"#9B4F40"],[0.71675391989113035,"#9B4F40"],[0.71679288076448167,"#9B4F40"],[0.71680092797614137,"#9B4F40"],[0.71689665199511599,"#9B4F40"],[0.71703503549837677,"#9B4F40"],[0.71745835895757348,"#9B4F40"],[0.71778280337872613,"#9B4E40"],[0.71810277058744276,"#9B4E3F"],[0.71810513941799337,"#9B4E3F"],[0.71820894244769906,"#9B4E3F"],[0.71830138212252037,"#9B4E3F"],[0.71842535983458644,"#9B4E3F"],[0.71855583223905883,"#9B4E3F"],[0.71872597086068091,"#9B4E3F"],[0.71874541740154885,"#9B4E3F"],[0.71929609606600475,"#9B4E3F"],[0.71932781848512439,"#9B4E3F"],[0.71968857160873834,"#9B4E3F"],[0.71979980848789293,"#9B4E3F"],[0.7198346145195903,"#9B4E3F"],[0.71987831736515739,"#9A4E3F"],[0.71990817581615452,"#9A4E3F"],[0.7203413436328685,"#9A4E3F"],[0.72046690900143617,"#9A4E3F"],[0.72046929786643399,"#9A4E3F"],[0.7206120689236345,"#9A4E3F"],[0.7210038881237758,"#9A4E3F"],[0.72115814669812739,"#9A4E3F"],[0.72135338218640976,"#9A4E3F"],[0.72151571379020918,"#9A4E3F"],[0.72151898734177222,"#9A4E3F"],[0.72153478397083592,"#9A4E3F"],[0.72162452033800562,"#9A4E3F"],[0.72201208502793568,"#9A4D3F"],[0.72211536371049223,"#9A4D3F"],[0.72239931233751675,"#9A4D3F"],[0.7224830639039459,"#9A4D3F"],[0.72250013788744549,"#9A4D3F"],[0.72276153872691373,"#9A4D3E"],[0.72285744731856572,"#9A4D3E"],[0.7229318111727201,"#9A4D3E"],[0.72317811053960235,"#9A4D3E"],[0.72326267254695731,"#9A4D3E"],[0.72335821864696692,"#9A4D3E"],[0.72376218287390204,"#9A4D3E"],[0.7238255437546538,"#9A4D3E"],[0.72387767098494749,"#9A4D3E"],[0.72388012814838221,"#9A4D3E"],[0.72410560442211991,"#9A4D3E"],[0.72414360525580357,"#9A4D3E"],[0.7243465692488622,"#9A4D3E"],[0.72450239216609802,"#9A4D3E"],[0.72480806167159906,"#9A4D3E"],[0.72483845506066591,"#9A4D3E"],[0.72492792016095642,"#9A4D3E"],[0.72498006373373358,"#9A4D3E"],[0.72513412437590463,"#9A4D3E"],[0.72515171058407146,"#9A4D3E"],[0.7254420806704257,"#9A4D3E"],[0.72562803976006607,"#9A4D3E"],[0.7257094926386074,"#9A4D3E"],[0.72572943433001658,"#9A4D3E"],[0.72582050449892277,"#9A4D3E"],[0.72595387928157507,"#9A4D3E"],[0.72606112078291829,"#9A4D3E"],[0.72617517894952077,"#994D3E"],[0.72637333562662665,"#994C3E"],[0.7264243982959695,"#994C3E"],[0.72642563831190099,"#994C3E"],[0.7265099640404602,"#994C3E"],[0.72654829900120843,"#994C3E"],[0.72670002452903804,"#994C3E"],[0.72682847348966517,"#994C3E"],[0.72693361303557169,"#994C3E"],[0.72701541623401278,"#994C3E"],[0.72707386210142144,"#994C3E"],[0.72710893563027634,"#994C3D"],[0.72712062780834907,"#994C3D"],[0.72712307492244299,"#994C3D"],[0.7271603301097429,"#994C3D"],[0.72726932912554521,"#994C3D"],[0.72727900683695013,"#994C3D"],[0.72736624009236672,"#994C3D"],[0.72769984272174359,"#994C3D"],[0.72800735231927283,"#994C3D"],[0.72802687767949481,"#994C3D"],[0.72816570226861255,"#994C3D"],[0.72872182734190072,"#994C3D"],[0.7287238594358576,"#994C3D"],[0.72895649348354108,"#994C3D"],[0.7290025277235137,"#994C3D"],[0.72909203775617004,"#994C3D"],[0.72918877959598372,"#994C3D"],[0.72941867954967288,"#994C3D"],[0.72961525344045619,"#994C3D"],[0.73009164517530933,"#994C3D"],[0.7301487144743295,"#994C3D"],[0.73019208451090445,"#994C3D"],[0.73019534532188968,"#994C3D"],[0.7307425924473725,"#994B3D"],[0.7308051942122622,"#994B3D"],[0.73083362582795064,"#994B3D"],[0.73117539562999201,"#994B3D"],[0.73118927556803992,"#994B3D"],[0.73137136129962887,"#994B3D"],[0.73141615194231591,"#994B3D"],[0.73155941415415882,"#994B3D"],[0.73197779564310439,"#994B3C"],[0.73213849276337983,"#994B3C"],[0.73250546658043003,"#984B3C"],[0.73256174354272607,"#984B3C"],[0.73261866617275972,"#984B3C"],[0.73265339635620474,"#984B3C"],[0.73274869044761681,"#984B3C"],[0.73295366984561994,"#984B3C"],[0.73308115710254063,"#984B3C"],[0.73312305739208972,"#984B3C"],[0.73366159408593123,"#984B3C"],[0.73380264011215801,"#984B3C"],[0.73400317141246685,"#984B3C"],[0.73417721518987333,"#984B3C"],[0.73419260761620775,"#984B3C"],[0.73429324089223003,"#984B3C"],[0.7343312226496157,"#984B3C"],[0.73446160641993874,"#984B3C"],[0.73466978710701525,"#984B3C"],[0.73490432022797025,"#984B3C"],[0.73496782528616911,"#984A3C"],[0.73513918124093069,"#984A3C"],[0.73546295091377689,"#984A3C"],[0.73558527415464436,"#984A3C"],[0.73569181140374018,"#984A3C"],[0.73578439005383167,"#984A3C"],[0.73582266618063641,"#984A3C"],[0.73586636569219133,"#984A3C"],[0.73600794772515066,"#984A3C"],[0.73611397281005952,"#984A3C"],[0.73625801824406367,"#984A3B"],[0.73640708929305176,"#984A3B"],[0.73664316956851283,"#984A3B"],[0.7367825918068911,"#984A3B"],[0.73703517279018804,"#984A3B"],[0.73713435396176918,"#984A3B"],[0.7372408335587517,"#984A3B"],[0.73733670210224944,"#984A3B"],[0.7373633786889815,"#984A3B"],[0.73746228033184025,"#984A3B"],[0.73748044983111338,"#984A3B"],[0.73752648478428662,"#984A3B"],[0.73776628149629531,"#984A3B"],[0.73804238910411479,"#984A3B"],[0.73804627415845858,"#984A3B"],[0.73829602449123499,"#984A3B"],[0.73830218125763292,"#984A3B"],[0.7383481583440098,"#984A3B"],[0.73836104145177739,"#984A3B"],[0.73853393207335249,"#974A3B"],[0.73874146232171878,"#974A3B"],[0.7388350810093367,"#974A3B"],[0.73892471424351991,"#974A3B"],[0.73908363668385291,"#974A3B"],[0.73908969000138747,"#974A3B"],[0.73917270446328365,"#974A3B"],[0.73921818516299531,"#974A3B"],[0.73925318437543663,"#974A3B"],[0.73932832193830089,"#97493B"],[0.73941401605691737,"#97493B"],[0.73943569809871246,"#97493B"],[0.73947524339915571,"#97493B"],[0.73951198671237117,"#97493B"],[0.73952423563524228,"#97493B"],[0.73966915011629331,"#97493B"],[0.73981447126661037,"#97493B"],[0.73986124583154833,"#97493B"],[0.74031753187683402,"#97493B"],[0.74050320406814008,"#97493B"],[0.7406104946854668,"#97493B"],[0.74080475989215389,"#97493A"],[0.74095922972935369,"#97493A"],[0.74113213534064348,"#97493A"],[0.74133724271827495,"#97493A"],[0.74155042800817095,"#97493A"],[0.74157401193276029,"#97493A"],[0.74178378037013115,"#97493A"],[0.74204129975495481,"#97493A"],[0.74223100959597854,"#97493A"],[0.74242238182949083,"#97493A"],[0.74257712239025842,"#97493A"],[0.74272247950918113,"#97493A"],[0.74299999350486012,"#97493A"],[0.74323354892119498,"#97493A"],[0.74332075318591317,"#97493A"],[0.7433805998020484,"#97493A"],[0.74343438619542968,"#97493A"],[0.743484217531027,"#97493A"],[0.74358304061302305,"#97493A"],[0.74401548278016616,"#97483A"],[0.74402529663952466,"#97483A"],[0.74456793722027115,"#97483A"],[0.74462695513259725,"#97483A"],[0.74466655681338922,"#96483A"],[0.74471858001865343,"#96483A"],[0.74485651524294982,"#96483A"],[0.74505443194315601,"#96483A"],[0.74521484830609186,"#96483A"],[0.74539430740587032,"#964839"],[0.74553156812521082,"#964839"],[0.74561322630915683,"#964839"],[0.74577899871806574,"#964839"],[0.74593382238090422,"#964839"],[0.7460825202753496,"#964839"],[0.74631924796675486,"#964839"],[0.74647369084060866,"#964839"],[0.74670145128780863,"#964839"],[0.74677477991150054,"#964839"],[0.74683544303797467,"#964839"],[0.74712966895555866,"#964839"],[0.74718588847247602,"#964839"],[0.74732743650790567,"#964839"],[0.74734417539660969,"#964839"],[0.74739406471459446,"#964839"],[0.74748115258427061,"#964839"],[0.74779508674132367,"#964839"],[0.74823825808469491,"#964739"],[0.74829245117178589,"#964739"],[0.74830584328329153,"#964739"],[0.74848152354911734,"#964739"],[0.74853454663573393,"#964739"],[0.74865682105355813,"#964739"],[0.74874299644322639,"#964739"],[0.7488621641789498,"#964739"],[0.74905065251362046,"#964739"],[0.74916861395937051,"#964739"],[0.74928375561012417,"#964739"],[0.74941963585500493,"#964739"],[0.74946206830420514,"#964739"],[0.74976366115909698,"#964739"],[0.75002231939774899,"#964738"],[0.75008262535745496,"#964738"],[0.75017438403210202,"#964738"],[0.75022526278293222,"#964738"],[0.75028425925571296,"#964738"],[0.750355540454126,"#964738"],[0.75037643238226215,"#964738"],[0.75059806656374795,"#964738"],[0.75064499330782486,"#964738"],[0.75085333663530462,"#954738"],[0.75088822648264053,"#954738"],[0.75104282093333441,"#954738"],[0.75110605765158556,"#954738"],[0.7512128074313893,"#954738"],[0.75129842006780567,"#954738"],[0.75146525459391877,"#954738"],[0.75157015353808254,"#954738"],[0.75160650979217725,"#954738"],[0.75166143790683093,"#954738"],[0.7517135604280073,"#954738"],[0.75172214200327081,"#954738"],[0.75180938171463951,"#954738"],[0.75181211541349069,"#954738"],[0.75185307722728401,"#954738"],[0.75187640211001483,"#954738"],[0.75191498212411567,"#954738"],[0.75192784346213548,"#954738"],[0.75216416599194269,"#954738"],[0.75244639879511555,"#954638"],[0.75280827230832537,"#954638"],[0.75289653914890087,"#954638"],[0.75306312239106066,"#954638"],[0.75313108405139351,"#954638"],[0.75320799849514308,"#954638"],[0.75331806445438043,"#954638"],[0.7535173136716109,"#954638"],[0.75388192489515238,"#954638"],[0.75394602008034539,"#954638"],[0.75396015049336162,"#954638"],[0.75420412003788251,"#954638"],[0.7546602507702993,"#954637"],[0.75481000400819964,"#954637"],[0.75493424140101095,"#954637"],[0.75503833233060424,"#954637"],[0.75507403459834044,"#954637"],[0.75516679855866786,"#954637"],[0.75535048219923839,"#954637"],[0.7554925945122013,"#954637"],[0.75574321511513465,"#954637"],[0.75596494581240448,"#954637"],[0.75601651068471842,"#954637"],[0.75628489288793133,"#954637"],[0.75665813749575017,"#954537"],[0.756761658941975,"#954537"],[0.75680123173291558,"#954537"],[0.75693429266273504,"#954537"],[0.75697376315045817,"#944537"],[0.75707532438453318,"#944537"],[0.75727516911968706,"#944537"],[0.75751307484815666,"#944537"],[0.75774241967464206,"#944537"],[0.75786741752713671,"#944537"],[0.75796041974003792,"#944537"],[0.75801100795034593,"#944537"],[0.75825397871941247,"#944537"],[0.7584203076922561,"#944537"],[0.75843470043414452,"#944537"],[0.75881869883919162,"#944537"],[0.75892464348704192,"#944536"],[0.75897684156088396,"#944536"],[0.75906675196626172,"#944536"],[0.75918226912079412,"#944536"],[0.75924033461558149,"#944536"],[0.75926943844380279,"#944536"],[0.759493670886076,"#944536"],[0.75986616416351649,"#944536"],[0.75998502489635111,"#944536"],[0.76002371559955428,"#944536"],[0.76033506030415121,"#944536"],[0.76044933068536635,"#944536"],[0.76045074682976488,"#944536"],[0.76060412226442975,"#944536"],[0.76069127791461844,"#944536"],[0.76078471370019285,"#944536"],[0.76089068691267625,"#944536"],[0.76101200834562699,"#944436"],[0.76104807076829029,"#944436"],[0.76130470258920402,"#944436"],[0.76161113930377289,"#944436"],[0.76163768680342336,"#944436"],[0.76168002648599431,"#944436"],[0.76169265874248226,"#944436"],[0.76200765655588665,"#944436"],[0.7620544279069521,"#944436"],[0.76238989047094208,"#944436"],[0.76240751206299151,"#944436"],[0.76255175007400389,"#944436"],[0.76255183967401174,"#944436"],[0.76269893486881246,"#944436"],[0.76274048062705391,"#944436"],[0.76280509274856056,"#944436"],[0.76298145776196447,"#944436"],[0.76301902724208581,"#944436"],[0.76318225737139356,"#934436"],[0.76323736420804722,"#934436"],[0.76339254599755402,"#934436"],[0.7633998934933921,"#934436"],[0.76346656781772992,"#934436"],[0.76366899089844698,"#934435"],[0.76384456458456362,"#934435"],[0.76395123768619921,"#934435"],[0.76399322895346322,"#934435"],[0.76411493312709955,"#934435"],[0.76420963535861952,"#934435"],[0.76422393156653412,"#934435"],[0.76427730310371089,"#934435"],[0.76431791307639319,"#934435"],[0.76433145128902868,"#934435"],[0.76439982850184418,"#934435"],[0.7644545449357294,"#934435"],[0.76447110619067915,"#934435"],[0.76473674312882023,"#934435"],[0.7647584612971583,"#934435"],[0.76497936068234185,"#934435"],[0.76502370123093544,"#934435"],[0.76503127958086925,"#934435"],[0.76507581043239159,"#934435"],[0.76579895386498131,"#934335"],[0.76610507003506112,"#934335"],[0.76615388444524168,"#934335"],[0.7661784997302854,"#934335"],[0.76623521925391602,"#934335"],[0.76627426471647853,"#934335"],[0.76652560781908141,"#934335"],[0.76654944521692014,"#934335"],[0.76692880304178213,"#934335"],[0.76717293093408545,"#934335"],[0.76725899453894053,"#934335"],[0.76727493573621985,"#934335"],[0.76743203684602435,"#934335"],[0.76779448515534154,"#934335"],[0.7678381758149575,"#934335"],[0.76797519090645605,"#934335"],[0.76805762113224951,"#934335"],[0.76831698433434581,"#934334"],[0.76857077479341873,"#934334"],[0.76864998157883657,"#934334"],[0.7687390236158802,"#934334"],[0.76886707874460158,"#934334"],[0.76929706242662343,"#924334"],[0.76929908430543259,"#924334"],[0.76930680310311095,"#924334"],[0.76935215942241986,"#924334"],[0.76950708915876398,"#924334"],[0.76986672556394686,"#924234"],[0.76992228167114196,"#924234"],[0.77002568969350937,"#924234"],[0.77036421126372301,"#924234"],[0.77051936262338627,"#924234"],[0.770606357443259,"#924234"],[0.77078164956539852,"#924234"],[0.77079390449895502,"#924234"],[0.77109012279850697,"#924234"],[0.77116028802354353,"#924234"],[0.77129169211850257,"#924234"],[0.77133614338934187,"#924234"],[0.77135283280953293,"#924234"],[0.77143267821175387,"#924234"],[0.77163436484380898,"#924234"],[0.77166221648454569,"#924234"],[0.77215189873417733,"#924234"],[0.77224789476890354,"#924234"],[0.7723177188488729,"#924234"],[0.77253668586483726,"#924234"],[0.77263209834841828,"#924234"],[0.77264254208218108,"#924234"],[0.77270898910894803,"#924233"],[0.77279742937825013,"#924233"],[0.77310612044057425,"#924233"],[0.77325856636600676,"#924233"],[0.77344377022667554,"#924233"],[0.77353741184363334,"#924233"],[0.77354246759609935,"#924233"],[0.77355033103433635,"#924233"],[0.77369544152029279,"#924233"],[0.77376032410086015,"#924233"],[0.77395142585350718,"#924133"],[0.77417507490784276,"#924133"],[0.77433284630872112,"#924133"],[0.77441816361449423,"#924133"],[0.77461203328664474,"#924133"],[0.7746477320999432,"#924133"],[0.77468658911008803,"#924133"],[0.77496225846581623,"#924133"],[0.77501252370669282,"#924133"],[0.7750669469606114,"#924133"],[0.77512392872860802,"#924133"],[0.77521105541482149,"#924133"],[0.77531052908273868,"#914133"],[0.77558049397704243,"#914133"],[0.77565952872892541,"#914133"],[0.77573183275559854,"#914133"],[0.77582231708673599,"#914133"],[0.77593388833510646,"#914133"],[0.77602213455958391,"#914133"],[0.77603590725432403,"#914133"],[0.77614213936310728,"#914133"],[0.77622118363730286,"#914133"],[0.7763780758596156,"#914133"],[0.77650272946466004,"#914133"],[0.77650652414428711,"#914133"],[0.77653299088572525,"#914133"],[0.77660647942666161,"#914133"],[0.7766529850563999,"#914133"],[0.77667790344774401,"#914133"],[0.77672076882723295,"#914133"],[0.776735059115922,"#914133"],[0.77677560855970318,"#914133"],[0.77696373286706111,"#914133"],[0.77712847189700873,"#914133"],[0.77729961627040456,"#914133"],[0.77759182128028803,"#914132"],[0.77760897950300401,"#914132"],[0.77776003056187404,"#914132"],[0.77791920313969587,"#914132"],[0.77792225824102812,"#914132"],[0.77838076160997316,"#914032"],[0.77838224466615957,"#914032"],[0.77843433806667206,"#914032"],[0.77864757509573856,"#914032"],[0.77870145550470726,"#914032"],[0.77914660182088491,"#914032"],[0.77917832923735131,"#914032"],[0.77929135699453889,"#914032"],[0.77938752856335858,"#914032"],[0.7795459533760819,"#914032"],[0.77985158762359286,"#914032"],[0.77988462119702384,"#914032"],[0.78009931259926746,"#914032"],[0.7802458050396619,"#914032"],[0.78042386827085097,"#914032"],[0.78059603701356073,"#914032"],[0.78063121136305913,"#914032"],[0.78063411092872781,"#914032"],[0.78063990950922346,"#914032"],[0.78072980811477788,"#914032"],[0.78128058967482095,"#914032"],[0.78164073283218405,"#904032"],[0.78169845993795439,"#904032"],[0.78193394253550541,"#904032"],[0.78193802618958186,"#904032"],[0.78196753454314782,"#904031"],[0.7820975262393306,"#904031"],[0.78213060805886414,"#904031"],[0.78226303412002185,"#904031"],[0.78227194302344993,"#904031"],[0.78236733762573252,"#904031"],[0.78256810058903714,"#903F31"],[0.78260359401465929,"#903F31"],[0.78273865049403235,"#903F31"],[0.78317057434221526,"#903F31"],[0.78327384750213602,"#903F31"],[0.78374521676741415,"#903F31"],[0.78375433397381178,"#903F31"],[0.78377761896113163,"#903F31"],[0.78382130365198754,"#903F31"],[0.78388790165053124,"#903F31"],[0.78393558268508379,"#903F31"],[0.7840068291481741,"#903F31"],[0.78429180543817356,"#903F31"],[0.78443686827169357,"#903F31"],[0.7845584607135303,"#903F31"],[0.78456441395881338,"#903F31"],[0.78468135183748622,"#903F31"],[0.78474516346588763,"#903F31"],[0.78481012658227844,"#903F31"],[0.78527316817901271,"#903F31"],[0.78529997547226649,"#903F31"],[0.78549557567519912,"#903F31"],[0.785710794210704,"#903F31"],[0.7857596226699749,"#903F31"],[0.78576115680590064,"#903F31"],[0.78582098372160325,"#903F31"],[0.78606997223062391,"#903F31"],[0.7861288447727991,"#903F31"],[0.78619348507506936,"#903F31"],[0.7865133525938024,"#903F31"],[0.78659385384551683,"#903F30"],[0.78659678492158214,"#903F30"],[0.78665088405491512,"#903F30"],[0.78674928127693988,"#903F30"],[0.78697089147835109,"#903E30"],[0.78699054656843248,"#903E30"],[0.78701189610800293,"#903E30"],[0.78706102360511332,"#903E30"],[0.78715303656062097,"#903E30"],[0.78731565069447718,"#903E30"],[0.78756509391921159,"#8F3E30"],[0.78756928513595093,"#8F3E30"],[0.78763091964280441,"#8F3E30"],[0.78791656680855415,"#8F3E30"],[0.78812308715094004,"#8F3E30"],[0.78817247235771715,"#8F3E30"],[0.78820555187119046,"#8F3E30"],[0.78827818531742011,"#8F3E30"],[0.78836336443402188,"#8F3E30"],[0.78839852838395497,"#8F3E30"],[0.78845008154379059,"#8F3E30"],[0.78845308827869942,"#8F3E30"],[0.78859463913284533,"#8F3E30"],[0.78874265654712905,"#8F3E30"],[0.78876072120240037,"#8F3E30"],[0.78879329052779434,"#8F3E30"],[0.78889670371888954,"#8F3E30"],[0.78900252848711017,"#8F3E30"],[0.78907815011436733,"#8F3E30"],[0.78912353610754915,"#8F3E30"],[0.78913866694281509,"#8F3E30"],[0.78929476336322357,"#8F3E30"],[0.78931453565481036,"#8F3E30"],[0.789364199512399,"#8F3E30"],[0.78937693166718748,"#8F3E30"],[0.78947207204950365,"#8F3E30"],[0.78964156786395645,"#8F3E30"],[0.79014910911759551,"#8F3E30"],[0.790165879548267,"#8F3E30"],[0.7903742623932315,"#8F3E30"],[0.79041593358021889,"#8F3E30"],[0.79059125500729932,"#8F3E30"],[0.79064228561613425,"#8F3E30"],[0.79088302412457745,"#8F3E30"],[0.79095648679714636,"#8F3E30"],[0.79102251786101185,"#8F3E30"],[0.79105691163969061,"#8F3E30"],[0.79114398556250254,"#8F3D30"],[0.79159383710799969,"#8F3D2F"],[0.79173635240276197,"#8F3D2F"],[0.7917381842040857,"#8F3D2F"],[0.79178842686535089,"#8F3D2F"],[0.79202055351961365,"#8F3D2F"],[0.79219804499639845,"#8F3D2F"],[0.79228554642058047,"#8F3D2F"],[0.79245116028602847,"#8F3D2F"],[0.79248839574837349,"#8F3D2F"],[0.79281230264465163,"#8F3D2F"],[0.79290825323871061,"#8F3D2F"],[0.7929100961112866,"#8F3D2F"],[0.79301469490308729,"#8F3D2F"],[0.79321231328262565,"#8F3D2F"],[0.7934334670001657,"#8F3D2F"],[0.79360672997942328,"#8E3D2F"],[0.79382388584040642,"#8E3D2F"],[0.7938875956987641,"#8E3D2F"],[0.79390780862190735,"#8E3D2F"],[0.7940068935902711,"#8E3D2F"],[0.7940955235708651,"#8E3D2F"],[0.79418357433218778,"#8E3D2F"],[0.79421926865921721,"#8E3D2F"],[0.79436210792502082,"#8E3D2F"],[0.79457459308452627,"#8E3D2F"],[0.7946566025487305,"#8E3D2F"],[0.79502628490055838,"#8E3D2F"],[0.79507841994000383,"#8E3D2F"],[0.79513739740229761,"#8E3D2F"],[0.79517403447915191,"#8E3D2F"],[0.79517465556346345,"#8E3D2F"],[0.79521238622413293,"#8E3D2F"],[0.79582091636041263,"#8E3C2F"],[0.7958416311775236,"#8E3C2F"],[0.79606797599735968,"#8E3C2E"],[0.79612427670145935,"#8E3C2E"],[0.79617585969133231,"#8E3C2E"],[0.79622922493831905,"#8E3C2E"],[0.79638862343356098,"#8E3C2E"],[0.79639992110499647,"#8E3C2E"],[0.79644881381145627,"#8E3C2E"],[0.79650303224027119,"#8E3C2E"],[0.7967220305011613,"#8E3C2E"],[0.79681267959968238,"#8E3C2E"],[0.79694914788047833,"#8E3C2E"],[0.79699754620404906,"#8E3C2E"],[0.79714406684303529,"#8E3C2E"],[0.79723297033742191,"#8E3C2E"],[0.79725084993912199,"#8E3C2E"],[0.79746835443037978,"#8E3C2E"],[0.79780857451038012,"#8E3C2E"],[0.79793837018569058,"#8E3C2E"],[0.79795730931787023,"#8E3C2E"],[0.79810389565919659,"#8E3C2E"],[0.79813739530630023,"#8E3C2E"],[0.79822757711324599,"#8E3C2E"],[0.79824691066752129,"#8E3C2E"],[0.79825027359162026,"#8E3C2E"],[0.79841579241102867,"#8E3C2E"],[0.79845844193179183,"#8E3C2E"],[0.79879791284822033,"#8E3C2E"],[0.79884359535243643,"#8E3C2E"],[0.79890114666771372,"#8E3C2E"],[0.7990908372275991,"#8E3C2E"],[0.79910386957253488,"#8E3C2E"],[0.79924052201089646,"#8E3C2E"],[0.7992613784640733,"#8E3C2E"],[0.79935476021601004,"#8E3C2E"],[0.79943211811218429,"#8E3C2E"],[0.79948032325580176,"#8E3C2E"],[0.79960638891311298,"#8D3C2E"],[0.79975831148733412,"#8D3B2E"],[0.79979436430789796,"#8D3B2E"],[0.79980198872374619,"#8D3B2E"],[0.79994102565320935,"#8D3B2E"],[0.8000431002490902,"#8D3B2E"],[0.80005200588605474,"#8D3B2E"],[0.80021397697484908,"#8D3B2E"],[0.80024427527803033,"#8D3B2E"],[0.80034937185034505,"#8D3B2E"],[0.80043710048441641,"#8D3B2E"],[0.80051599464626,"#8D3B2E"],[0.80064920105400594,"#8D3B2D"],[0.80073514716634908,"#8D3B2D"],[0.8007560547594863,"#8D3B2D"],[0.80095470167440819,"#8D3B2D"],[0.80096434106346481,"#8D3B2D"],[0.80114075371796545,"#8D3B2D"],[0.80114267214919221,"#8D3B2D"],[0.8012456842702198,"#8D3B2D"],[0.8012852078337418,"#8D3B2D"],[0.80139763367532191,"#8D3B2D"],[0.80140772088023937,"#8D3B2D"],[0.80144882489442826,"#8D3B2D"],[0.80147797682849842,"#8D3B2D"],[0.80148246178182725,"#8D3B2D"],[0.80152619833158589,"#8D3B2D"],[0.80154227476970852,"#8D3B2D"],[0.80158372686329715,"#8D3B2D"],[0.80162347754331686,"#8D3B2D"],[0.80163555416152676,"#8D3B2D"],[0.80170813513638828,"#8D3B2D"],[0.80183829254037375,"#8D3B2D"],[0.80196200423585262,"#8D3B2D"],[0.80218806445241131,"#8D3B2D"],[0.80257319111982084,"#8D3B2D"],[0.80269349653048105,"#8D3B2D"],[0.80271192455121643,"#8D3B2D"],[0.80279344823097865,"#8D3B2D"],[0.80296321313651231,"#8D3B2D"],[0.80300577162938414,"#8D3B2D"],[0.803048392959399,"#8D3B2D"],[0.80314486358821491,"#8D3B2D"],[0.80346152368303914,"#8D3B2D"],[0.80348293637458057,"#8D3B2D"],[0.80351994297211182,"#8D3B2D"],[0.80353272915344354,"#8D3B2D"],[0.80380678765739322,"#8D3B2D"],[0.80391379362468252,"#8D3A2D"],[0.80397807988375658,"#8D3A2D"],[0.80414946723528491,"#8D3A2D"],[0.80415287682404968,"#8D3A2D"],[0.8041565576854337,"#8D3A2D"],[0.8043172675010406,"#8D3A2D"],[0.80444254741579069,"#8D3A2D"],[0.80478873246284299,"#8D3A2D"],[0.80508511273610073,"#8D3A2D"],[0.8050942487526509,"#8D3A2D"],[0.80513716423660397,"#8D3A2D"],[0.80527010260847387,"#8D3A2C"],[0.8052718447079551,"#8D3A2C"],[0.80544437175551398,"#8D3A2C"],[0.80548932578860832,"#8D3A2C"],[0.80557910202034633,"#8C3A2C"],[0.80560614623335669,"#8C3A2C"],[0.80581854300110745,"#8C3A2C"],[0.80582312896176334,"#8C3A2C"],[0.80598177671446014,"#8C3A2C"],[0.80609780038992773,"#8C3A2C"],[0.80627024274080195,"#8C3A2C"],[0.80641359627937037,"#8C3A2C"],[0.80641934542519889,"#8C3A2C"],[0.80653097481621616,"#8C3A2C"],[0.80659552711541282,"#8C3A2C"],[0.80692190894243776,"#8C3A2C"],[0.80697906917882412,"#8C3A2C"],[0.80706607674088238,"#8C3A2C"],[0.80720831798236381,"#8C3A2C"],[0.80737685646858148,"#8C3A2C"],[0.80752791798508428,"#8C3A2C"],[0.80761517376820402,"#8C3A2C"],[0.80766873696441821,"#8C3A2C"],[0.80783701725462287,"#8C3A2C"],[0.80785483587902285,"#8C3A2C"],[0.80801543844070434,"#8C3A2C"],[0.80801897247964338,"#8C3A2C"],[0.80803266597337975,"#8C3A2C"],[0.80814816171142323,"#8C392C"],[0.80814932192267197,"#8C392C"],[0.808355964378764,"#8C392C"],[0.8084565467304996,"#8C392C"],[0.80847021634944793,"#8C392C"],[0.80884376673744174,"#8C392C"],[0.80892435578856348,"#8C392C"],[0.80903600575633028,"#8C392C"],[0.80905415834420613,"#8C392C"],[0.80940004270225707,"#8C392C"],[0.80950885572513542,"#8C392C"],[0.80960436811649439,"#8C392C"],[0.80960637259531532,"#8C392C"],[0.80970928679103615,"#8C392C"],[0.80972014928075176,"#8C392C"],[0.80977898574957419,"#8C392C"],[0.80995365264437769,"#8C392B"],[0.81012658227848111,"#8C392B"],[0.81013596088399109,"#8C392B"],[0.81022620337924489,"#8C392B"],[0.81030564786268156,"#8C392B"],[0.81047509502571824,"#8C392B"],[0.81053332722045424,"#8C392B"],[0.81054155109280035,"#8C392B"],[0.81060444890028105,"#8C392B"],[0.81061452366021003,"#8C392B"],[0.81103852993739478,"#8C392B"],[0.81106994672654653,"#8C392B"],[0.81116927992742016,"#8C392B"],[0.81142880313715826,"#8C392B"],[0.81147422841030514,"#8C392B"],[0.81149261579016863,"#8C392B"],[0.81152950726594431,"#8C392B"],[0.81176001771972361,"#8B392B"],[0.81186033527349455,"#8B392B"],[0.81187690017535652,"#8B392B"],[0.81188231007260869,"#8B392B"],[0.81202306348908881,"#8B392B"],[0.81223882425840666,"#8B392B"],[0.81234318212991108,"#8B392B"],[0.81234764449156238,"#8B382B"],[0.81245392805726413,"#8B382B"],[0.81249694493436586,"#8B382B"],[0.8125619690180913,"#8B382B"],[0.81261179780900417,"#8B382B"],[0.81265660453350774,"#8B382B"],[0.81271319444178469,"#8B382B"],[0.81279567573757106,"#8B382B"],[0.81285157149698894,"#8B382B"],[0.81306766374489636,"#8B382B"],[0.81310747576700548,"#8B382B"],[0.81332954323868922,"#8B382B"],[0.81343519309168499,"#8B382B"],[0.8135176530310857,"#8B382B"],[0.81362272695337345,"#8B382B"],[0.81367170229711538,"#8B382B"],[0.81375227455388333,"#8B382B"],[0.81378796290711941,"#8B382B"],[0.81379160650245308,"#8B382B"],[0.81387729965616273,"#8B382B"],[0.81391010640084338,"#8B382B"],[0.81392873449162384,"#8B382B"],[0.81393266473661763,"#8B382B"],[0.81394588259660161,"#8B382B"],[0.81407286166450565,"#8B382B"],[0.81423558812427321,"#8B382B"],[0.81425989784686847,"#8B382B"],[0.81434380919347282,"#8B382B"],[0.81435243027815785,"#8B382B"],[0.81459268229175819,"#8B382B"],[0.81487664379196234,"#8B382A"],[0.81499366160276154,"#8B382A"],[0.81511086854588521,"#8B382A"],[0.81517709884690737,"#8B382A"],[0.81522235610576532,"#8B382A"],[0.81559377639699226,"#8B382A"],[0.81562901661442377,"#8B382A"],[0.81573592755740265,"#8B382A"],[0.81577959531678046,"#8B382A"],[0.81580359102864131,"#8B382A"],[0.81607040294807986,"#8B382A"],[0.81610440840133947,"#8B382A"],[0.81634354643448215,"#8B382A"],[0.81643591661763071,"#8B382A"],[0.81648922395143531,"#8B382A"],[0.81672157707836379,"#8B372A"],[0.81682657919369994,"#8B372A"],[0.81688752595598257,"#8B372A"],[0.81721366966594844,"#8B372A"],[0.81730549352709903,"#8B372A"],[0.81737164879407243,"#8B372A"],[0.81742046848722794,"#8B372A"],[0.81746732696874658,"#8B372A"],[0.81749009263730665,"#8B372A"],[0.8176733093603068,"#8A372A"],[0.81769743763007796,"#8A372A"],[0.81780649328839994,"#8A372A"],[0.81811988904908839,"#8A372A"],[0.81842734627982672,"#8A372A"],[0.81847936957030332,"#8A372A"],[0.81866826198618892,"#8A372A"],[0.81871076481407012,"#8A372A"],[0.81877445030282514,"#8A372A"],[0.81884026482746908,"#8A372A"],[0.81893853349134438,"#8A372A"],[0.81913552466976303,"#8A372A"],[0.81914923962390507,"#8A372A"],[0.81929929018844538,"#8A372A"],[0.81933501848234247,"#8A3729"],[0.81962550530057099,"#8A3729"],[0.81972426060267578,"#8A3729"],[0.81974560595785773,"#8A3729"],[0.8197962453552704,"#8A3729"],[0.81983860300136546,"#8A3729"],[0.82009914298288633,"#8A3729"],[0.82021761434196361,"#8A3729"],[0.8204950616315817,"#8A3729"],[0.82064600170118429,"#8A3729"],[0.82074336861690067,"#8A3729"],[0.82078364293599892,"#8A3629"],[0.82092423069294262,"#8A3629"],[0.82094838320421926,"#8A3629"],[0.8211182532535477,"#8A3629"],[0.82116329432056068,"#8A3629"],[0.82120271456175487,"#8A3629"],[0.82144048865775077,"#8A3629"],[0.82150574241691499,"#8A3629"],[0.82170782902848405,"#8A3629"],[0.82177050341433489,"#8A3629"],[0.82177240679819508,"#8A3629"],[0.82183242735609685,"#8A3629"],[0.82202201935817265,"#8A3629"],[0.82211537174599292,"#8A3629"],[0.82226345443136128,"#8A3629"],[0.8224111227234,"#8A3629"],[0.82273762206995882,"#8A3629"],[0.82278481012658222,"#8A3629"],[0.82288748176641047,"#8A3629"],[0.82289215014831552,"#8A3629"],[0.82297440427995916,"#8A3629"],[0.82304555445864946,"#8A3629"],[0.82312931842221093,"#8A3629"],[0.8231721143532803,"#8A3629"],[0.82327159282296369,"#8A3629"],[0.82362823018581011,"#893629"],[0.82372351610309624,"#893629"],[0.82373452051175644,"#893629"],[0.82392200731887222,"#893629"],[0.82394175390637681,"#893629"],[0.82401739143967312,"#893629"],[0.82414031122215492,"#893628"],[0.82424015569470443,"#893628"],[0.82424377470424381,"#893628"],[0.82431350802723735,"#893628"],[0.82448077638932271,"#893628"],[0.82452172787126077,"#893628"],[0.82476781610657679,"#893628"],[0.82486753490058629,"#893628"],[0.82492147183504794,"#893628"],[0.82513138472906966,"#893528"],[0.82517752099753017,"#893528"],[0.8252574535031818,"#893528"],[0.82532571070437677,"#893528"],[0.82545149531547735,"#893528"],[0.82557402763451815,"#893528"],[0.825601862999362,"#893528"],[0.82568211213362264,"#893528"],[0.82568928804890163,"#893528"],[0.82569822700537632,"#893528"],[0.82589002029619696,"#893528"],[0.82589075095085585,"#893528"],[0.82605088219552247,"#893528"],[0.82605575778923523,"#893528"],[0.82618420473858067,"#893528"],[0.82627601070461154,"#893528"],[0.82633111757913857,"#893528"],[0.82634949042349481,"#893528"],[0.82644229940851111,"#893528"],[0.82654298084440692,"#893528"],[0.8265984780334652,"#893528"],[0.82670818029253079,"#893528"],[0.82682713396500696,"#893528"],[0.82684164116339731,"#893528"],[0.82687764029063959,"#893528"],[0.82716393792627785,"#893528"],[0.82720546331853928,"#893528"],[0.82751307536415231,"#893528"],[0.82761468945576722,"#893528"],[0.82773229983728591,"#893528"],[0.82777710090340828,"#893528"],[0.82815400639731895,"#893528"],[0.82822433965747233,"#893528"],[0.8282993325380148,"#893528"],[0.82847054925528218,"#893528"],[0.82860501174716328,"#893528"],[0.82870300350773229,"#893528"],[0.82887666825009543,"#893527"],[0.82894209360012272,"#893527"],[0.82917450665930326,"#893427"],[0.82919777781498694,"#893427"],[0.82926736194443995,"#893427"],[0.82940251439862789,"#893427"],[0.82944477150409179,"#883427"],[0.82953174183171108,"#883427"],[0.82969106456208386,"#883427"],[0.83003628796210394,"#883427"],[0.83021843400517681,"#883427"],[0.83025109005753517,"#883427"],[0.83029655607342834,"#883427"],[0.83062254825393611,"#883427"],[0.83075045230956834,"#883427"],[0.83088710323906301,"#883427"],[0.83102348868472642,"#883427"],[0.83114780425375789,"#883427"],[0.83131663396136779,"#883427"],[0.83143273958241071,"#883427"],[0.83144110305452401,"#883427"],[0.8315489879461877,"#883427"],[0.83163906016263445,"#883427"],[0.83170959092598518,"#883427"],[0.8317532463826639,"#883427"],[0.83176150019639183,"#883427"],[0.83181348830321677,"#883427"],[0.8318593139661844,"#883427"],[0.83246467015486336,"#883427"],[0.83281581032255025,"#883427"],[0.83297471220280339,"#883427"],[0.83313255809855846,"#883427"],[0.8331758233612222,"#883427"],[0.83327656496166436,"#883427"],[0.83330040876106426,"#883427"],[0.83331713340383629,"#883427"],[0.83335281355781099,"#883327"],[0.83341159752933336,"#883327"],[0.83344958935473468,"#883327"],[0.83376473876639368,"#883326"],[0.83389506235264754,"#883326"],[0.83393929234372088,"#883326"],[0.83401744187984639,"#883326"],[0.83410176179051276,"#883326"],[0.83410559593222366,"#883326"],[0.8343608033153328,"#883326"],[0.83461646839429515,"#883326"],[0.83492036052395635,"#883326"],[0.83512468056224232,"#883326"],[0.83518435377974642,"#883326"],[0.83520551487221684,"#883326"],[0.83533485442895294,"#883326"],[0.83537541492737377,"#883326"],[0.83544303797468356,"#873326"],[0.83566774462269278,"#873326"],[0.83571032266802847,"#873326"],[0.83580267761376026,"#873326"],[0.83592848320709523,"#873326"],[0.83603085158540846,"#873326"],[0.83616504832435679,"#873326"],[0.83623578031215051,"#873326"],[0.83627384495346579,"#873326"],[0.83637636483469269,"#873326"],[0.83643662388726825,"#873326"],[0.83656252782986185,"#873326"],[0.8367778657057785,"#873326"],[0.83678637361740615,"#873326"],[0.8370338104036692,"#873326"],[0.83715822348222058,"#873326"],[0.83730996387493617,"#873326"],[0.83738393141564038,"#873326"],[0.83741828753669822,"#873326"],[0.8374916524844398,"#873326"],[0.83778642370235501,"#873226"],[0.83785367859854221,"#873226"],[0.83791592623789846,"#873226"],[0.83804232605841777,"#873226"],[0.83811669348966045,"#873226"],[0.83825917506045056,"#873226"],[0.83830171407441356,"#873225"],[0.83831325239003196,"#873225"],[0.83832879026585627,"#873225"],[0.83840847244461958,"#873225"],[0.83843681345694421,"#873225"],[0.83857090881947027,"#873225"],[0.83857511180109578,"#873225"],[0.83867396891892088,"#873225"],[0.83873331227751935,"#873225"],[0.83875309825038813,"#873225"],[0.83877808054282688,"#873225"],[0.83886489161465505,"#873225"],[0.83893305778730431,"#873225"],[0.83902126951680933,"#873225"],[0.83928309565802794,"#873225"],[0.83937783464417448,"#873225"],[0.84001581039970286,"#873225"],[0.84010952533164174,"#873225"],[0.84015580627527819,"#873225"],[0.84021888465746064,"#873225"],[0.84037227241992773,"#873225"],[0.84042699964515555,"#873225"],[0.84051936084320478,"#873225"],[0.84067696385196333,"#873225"],[0.84085490291795228,"#873225"],[0.84090020176305846,"#873225"],[0.84112001765732947,"#873225"],[0.8413565736135995,"#863225"],[0.84141190789926013,"#863225"],[0.84142855164827768,"#863225"],[0.84147789265576556,"#863225"],[0.84159917122467909,"#863225"],[0.84198590174110766,"#863125"],[0.84238703080660982,"#863125"],[0.84246937113449161,"#863125"],[0.84254044422937091,"#863125"],[0.84268450644359683,"#863125"],[0.84281595437768941,"#863125"],[0.84289062481509003,"#863125"],[0.84291815478782572,"#863125"],[0.84315782875254675,"#863124"],[0.84322339903875532,"#863124"],[0.84331957378822797,"#863124"],[0.8433810155700483,"#863124"],[0.84360960503251958,"#863124"],[0.84392306037969556,"#863124"],[0.84392659239992585,"#863124"],[0.84393229720407759,"#863124"],[0.84424143457145406,"#863124"],[0.84436629681128006,"#863124"],[0.84460922698348884,"#863124"],[0.84464156458375794,"#863124"],[0.84469103922572764,"#863124"],[0.84508548812765538,"#863124"],[0.84513743158153032,"#863124"],[0.84526623616530872,"#863124"],[0.84531289512397878,"#863124"],[0.84540872398524536,"#863124"],[0.84554022559530462,"#863124"],[0.84576665438589105,"#863024"],[0.84590712822214431,"#863024"],[0.84599245191154793,"#863024"],[0.84619804161774903,"#863024"],[0.84631628542785131,"#863024"],[0.84638437681863898,"#863024"],[0.8464092896680997,"#863024"],[0.8464165359800101,"#863024"],[0.84672985386337096,"#863024"],[0.84682200187480117,"#863024"],[0.84701290841559074,"#863024"],[0.84719593633263668,"#863024"],[0.84746241236179098,"#853024"],[0.84757704709290904,"#853024"],[0.847678058054957,"#853024"],[0.84770339063245359,"#853024"],[0.8477216971386361,"#853024"],[0.84785039040602328,"#853023"],[0.84792655735135924,"#853023"],[0.84810126582278478,"#853023"],[0.84843324087424032,"#853023"],[0.84857506925695136,"#853023"],[0.84858514997984691,"#853023"],[0.84880478040372187,"#853023"],[0.84883401836040751,"#853023"],[0.84890892729952216,"#853023"],[0.84902494122908889,"#853023"],[0.84902831173073279,"#853023"],[0.84910802351903736,"#853023"],[0.84913029434686182,"#853023"],[0.8494284201227873,"#853023"],[0.84943039150817223,"#853023"],[0.84965351301459668,"#853023"],[0.84979105940672528,"#853023"],[0.85008943824720329,"#852F23"],[0.85011001648813311,"#852F23"],[0.85015358536050356,"#852F23"],[0.85038699598469492,"#852F23"],[0.85044411148867793,"#852F23"],[0.85055394063381184,"#852F23"],[0.85062176438971493,"#852F23"],[0.85069700224902001,"#852F23"],[0.85081412242486854,"#852F23"],[0.85086578645041888,"#852F23"],[0.85095935352633623,"#852F23"],[0.85096390587530635,"#852F23"],[0.85100181964310662,"#852F23"],[0.851070986284441,"#852F23"],[0.85111184633637049,"#852F23"],[0.8511352715016216,"#852F23"],[0.85115670607728133,"#852F23"],[0.8512176081574877,"#852F23"],[0.85128110135229118,"#852F23"],[0.85140017977990423,"#852F23"],[0.8517047990787685,"#852F23"],[0.85194817216068541,"#852F23"],[0.85244948406973842,"#852F23"],[0.85247082215544867,"#852F23"],[0.85267617101985893,"#852F22"],[0.85277117664576862,"#852F22"],[0.85287661836655126,"#852F22"],[0.85291228683673292,"#852F22"],[0.85296137205456968,"#852F22"],[0.85331215018514972,"#842F22"],[0.85339954173284505,"#842F22"],[0.85348546617843224,"#842F22"],[0.85361039297568486,"#842F22"],[0.85372549738530812,"#842F22"],[0.85389023516762941,"#842F22"],[0.85440558719016557,"#842E22"],[0.85450674931681825,"#842E22"],[0.85464502302876522,"#842E22"],[0.8547316841595537,"#842E22"],[0.85473774057752294,"#842E22"],[0.85484731281784143,"#842E22"],[0.8549436676101001,"#842E22"],[0.85536453604234175,"#842E22"],[0.85547832370886179,"#842E22"],[0.8555702555005964,"#842E22"],[0.85594592727876617,"#842E22"],[0.85601157883052825,"#842E22"],[0.85601422935973259,"#842E22"],[0.85616706946729593,"#842E22"],[0.85618306301274139,"#842E22"],[0.85637903119823111,"#842E22"],[0.85656625138678111,"#842E22"],[0.85695928460930815,"#842E22"],[0.85696165624277754,"#842E22"],[0.85701798797043782,"#842E22"],[0.8572139891477355,"#842E22"],[0.85721866590069951,"#842E22"],[0.85759622988640705,"#842E21"],[0.85769966024115152,"#842E21"],[0.85772923589701122,"#842E21"],[0.85799495002575243,"#842E21"],[0.85837952342396728,"#842D21"],[0.85839644038224083,"#842D21"],[0.85844832599755794,"#842D21"],[0.85853769148262427,"#842D21"],[0.8586056713077288,"#842D21"],[0.85886650124790065,"#842D21"],[0.8589584619950037,"#842D21"],[0.85905138529372149,"#832D21"],[0.85915069106126019,"#832D21"],[0.85928983687813154,"#832D21"],[0.85958462111145828,"#832D21"],[0.85964804803300243,"#832D21"],[0.8596639092425622,"#832D21"],[0.85987594057052252,"#832D21"],[0.86017067181643425,"#832D21"],[0.8602334545007182,"#832D21"],[0.86051123339623814,"#832D21"],[0.86067669109320488,"#832D21"],[0.86075949367088622,"#832D21"],[0.86081226016900281,"#832D21"],[0.86094049073719947,"#832D21"],[0.86104114653138319,"#832D21"],[0.86106380413472028,"#832D21"],[0.86124153195197306,"#832D21"],[0.86135257394844578,"#832D21"],[0.86155287385501289,"#832D21"],[0.86167910932348357,"#832D21"],[0.86193883549247374,"#832D21"],[0.8619400640741911,"#832D21"],[0.86194490092752263,"#832D21"],[0.86200979660205823,"#832D21"],[0.86207180262790184,"#832D21"],[0.8621732846244311,"#832C21"],[0.86241922753033307,"#832C20"],[0.86272104033521291,"#832C20"],[0.86290462706469939,"#832C20"],[0.86297693964078759,"#832C20"],[0.86302715491984894,"#832C20"],[0.8630305603914592,"#832C20"],[0.86318666781331344,"#832C20"],[0.86335001226451902,"#832C20"],[0.86346680651778596,"#832C20"],[0.86347332781266084,"#832C20"],[0.86353693105071083,"#832C20"],[0.86356031390417454,"#832C20"],[0.86358991678681618,"#832C20"],[0.86363950341847506,"#832C20"],[0.86368312004618342,"#832C20"],[0.86380665963384529,"#832C20"],[0.86383717276108107,"#832C20"],[0.86408285113430627,"#832C20"],[0.86413019862060181,"#832C20"],[0.86429920920763759,"#832C20"],[0.86485009088279208,"#822C20"],[0.86507435723716486,"#822C20"],[0.86509604225545222,"#822C20"],[0.8654025971061311,"#822C20"],[0.86554269428429864,"#822C20"],[0.86590203592131609,"#822C20"],[0.866050727241098,"#822C20"],[0.86606924638168992,"#822C20"],[0.8661160294389123,"#822B20"],[0.86623650681067332,"#822B20"],[0.86632021550386784,"#822B20"],[0.86647683492281002,"#822B20"],[0.86664722967371222,"#822B20"],[0.86677606416723707,"#822B20"],[0.86700158570623342,"#822B20"],[0.86709630380810387,"#822B1F"],[0.86784590570187015,"#822B1F"],[0.86789219502691584,"#822B1F"],[0.86805782963145472,"#822B1F"],[0.86828457996328479,"#822B1F"],[0.86832707866911685,"#822B1F"],[0.86832804480905157,"#822B1F"],[0.86864214209100821,"#822B1F"],[0.86868168934449075,"#822B1F"],[0.86874022491555669,"#822B1F"],[0.86876324239214331,"#822B1F"],[0.86880161382687993,"#822B1F"],[0.86898862424972045,"#822B1F"],[0.86918052072588869,"#822B1F"],[0.86954484500069373,"#822B1F"],[0.8703052473427334,"#822A1F"],[0.87040237994607694,"#822A1F"],[0.87040409748890446,"#822A1F"],[0.87047961486467695,"#822A1F"],[0.87050768915290733,"#822A1F"],[0.87056606767032174,"#822A1F"],[0.87057253740777796,"#822A1F"],[0.87074824974557563,"#812A1F"],[0.8710206498774774,"#812A1F"],[0.87116825474310422,"#812A1F"],[0.87128127262829191,"#812A1F"],[0.8713230312428506,"#812A1F"],[0.8716902999010242,"#812A1F"],[0.8717421087655135,"#812A1F"],[0.87201264831976233,"#812A1E"],[0.87231347756629862,"#812A1E"],[0.87242825762147491,"#812A1E"],[0.87246390863059275,"#812A1E"],[0.87271949186205289,"#812A1E"],[0.87288949935903282,"#812A1E"],[0.87296691119045211,"#812A1E"],[0.87308679219710017,"#812A1E"],[0.8731653274292972,"#812A1E"],[0.87341772151898733,"#812A1E"],[0.87359294423623801,"#812A1E"],[0.8736500633504789,"#812A1E"],[0.87369436739520023,"#812A1E"],[0.87375908940357228,"#812A1E"],[0.87389754337066183,"#812A1E"],[0.87415292164164582,"#81291E"],[0.87426727331786691,"#81291E"],[0.87432841052677901,"#81291E"],[0.87450667847981578,"#81291E"],[0.87470981792750246,"#81291E"],[0.87491938829118998,"#81291E"],[0.87504131267872753,"#81291E"],[0.87514212962785654,"#81291E"],[0.87529903328187397,"#81291E"],[0.87532249665391249,"#81291E"],[0.87555302882579278,"#81291E"],[0.8755780731596523,"#81291E"],[0.8756005665332629,"#81291E"],[0.87573262729695944,"#81291E"],[0.87586107100163546,"#81291E"],[0.87593820105500741,"#81291E"],[0.87596392173106774,"#81291E"],[0.87596930547477458,"#81291E"],[0.87608208299597135,"#81291E"],[0.87622048004729625,"#81291E"],[0.8762349535187719,"#81291E"],[0.87640413615416268,"#81291E"],[0.87653156119553033,"#80291E"],[0.87665903222719022,"#80291E"],[0.87710673904030234,"#80291D"],[0.87746712070050548,"#80291D"],[0.87787160755756732,"#80291D"],[0.87798622995139264,"#80291D"],[0.87811383068973559,"#80281D"],[0.87814244644396566,"#80281D"],[0.87828031232481862,"#80281D"],[0.87848688157522914,"#80281D"],[0.87853766219226659,"#80281D"],[0.87870874539750199,"#80281D"],[0.87874659269939226,"#80281D"],[0.8792808621492485,"#80281D"],[0.87946232174352101,"#80281D"],[0.87959113456039706,"#80281D"],[0.8796347192219014,"#80281D"],[0.8803895206324035,"#80281D"],[0.88039235685009642,"#80281D"],[0.88052403538414525,"#80281D"],[0.88058260578399905,"#80281D"],[0.88062655244285726,"#80281D"],[0.88100382827794332,"#80281D"],[0.88118033560955655,"#80281D"],[0.88127270535148816,"#80281D"],[0.88127591983700593,"#80281D"],[0.88137024031352695,"#80281D"],[0.88144102991417594,"#80281D"],[0.88211196578326712,"#80271C"],[0.88237923064857915,"#7F271C"],[0.88248968034117092,"#7F271C"],[0.88278764588201408,"#7F271C"],[0.88287567201815831,"#7F271C"],[0.88289947693249071,"#7F271C"],[0.88307694222262079,"#7F271C"],[0.88313869680476986,"#7F271C"],[0.88358646546704267,"#7F271C"],[0.88363746786811004,"#7F271C"],[0.8836495838472016,"#7F271C"],[0.88371601842301217,"#7F271C"],[0.88379881800358417,"#7F271C"],[0.8843249907894184,"#7F271C"],[0.88443353937230085,"#7F271C"],[0.88475354457938193,"#7F271C"],[0.88496114083557109,"#7F271C"],[0.88501284484675469,"#7F271C"],[0.88515895829748648,"#7F271C"],[0.8851802820440835,"#7F271C"],[0.88554506139925349,"#7F271C"],[0.8856502257214327,"#7F271C"],[0.88571633910587688,"#7F271C"],[0.88607594936708867,"#7F261C"],[0.8861163377728688,"#7F261C"],[0.88626834293241863,"#7F261C"],[0.88632493065568019,"#7F261C"],[0.88635449455447413,"#7F261C"],[0.88639871468912501,"#7F261C"],[0.88655306022028713,"#7F261B"],[0.8869757129267537,"#7F261B"],[0.88734329455504413,"#7F261B"],[0.8874318695025053,"#7F261B"],[0.88748112923290812,"#7F261B"],[0.88756707868540252,"#7F261B"],[0.88765526454136945,"#7F261B"],[0.8878297643644627,"#7F261B"],[0.88791115854336811,"#7F261B"],[0.88801106727979195,"#7F261B"],[0.88811059181865148,"#7F261B"],[0.88816109773029239,"#7E261B"],[0.88825136473233002,"#7E261B"],[0.88825326207214361,"#7E261B"],[0.88833895172387201,"#7E261B"],[0.88836752955796106,"#7E261B"],[0.8885804317192918,"#7E261B"],[0.88864980813520233,"#7E261B"],[0.8888510433077762,"#7E261B"],[0.88958916461867565,"#7E261B"],[0.88969376428167934,"#7E261B"],[0.8897729766880409,"#7E251B"],[0.88992579381179637,"#7E251B"],[0.8899476558656978,"#7E251B"],[0.89012290251983095,"#7E251B"],[0.89067126757119475,"#7E251B"],[0.8908492299689772,"#7E251B"],[0.8910416852199079,"#7E251B"],[0.89113151706001092,"#7E251B"],[0.89137715595987221,"#7E251A"],[0.89187716698690589,"#7E251A"],[0.89194395082526567,"#7E251A"],[0.89196779134254189,"#7E251A"],[0.89200341457408705,"#7E251A"],[0.89232160108063718,"#7E251A"],[0.8926365840895063,"#7E251A"],[0.892855397105352,"#7E251A"],[0.89318068574294474,"#7E251A"],[0.89349990134352908,"#7E251A"],[0.89378254695960579,"#7E241A"],[0.89378464256797552,"#7E241A"],[0.89390326861196823,"#7E241A"],[0.89406154357547007,"#7D241A"],[0.89410277593559517,"#7D241A"],[0.894181682217011,"#7D241A"],[0.89465726782740518,"#7D241A"],[0.89468846583359363,"#7D241A"],[0.89547824339857318,"#7D241A"],[0.8955284558198453,"#7D241A"],[0.89557199278125132,"#7D241A"],[0.89568929799647623,"#7D241A"],[0.89595486480271835,"#7D241A"],[0.89609902249819928,"#7D241A"],[0.89624419787418674,"#7D2419"],[0.89640615132232582,"#7D2419"],[0.89642938126406424,"#7D2419"],[0.89691194292020326,"#7D2419"],[0.89695390431095368,"#7D2419"],[0.89704776178543255,"#7D2419"],[0.89732830127436525,"#7D2419"],[0.89760619311206646,"#7D2319"],[0.89811461246915947,"#7D2319"],[0.89819704475384565,"#7D2319"],[0.89819996055249829,"#7D2319"],[0.89825151612013565,"#7D2319"],[0.89840633979984119,"#7D2319"],[0.89861648516871095,"#7D2319"],[0.89873417721518989,"#7D2319"],[0.89895549391616014,"#7D2319"],[0.89905194782959841,"#7D2319"],[0.89920789620551433,"#7D2319"],[0.89939895642411016,"#7D2319"],[0.89954541861379955,"#7D2319"],[0.89962026100544823,"#7D2319"],[0.89997051282660467,"#7C2319"],[0.90010698848742454,"#7C2319"],[0.90025799732312994,"#7C2319"],[0.90048217053173241,"#7C2319"],[0.9006426039168709,"#7C2319"],[0.90070386044011963,"#7C2319"],[0.90073898841424915,"#7C2319"],[0.90074123089091362,"#7C2319"],[0.90077113738485426,"#7C2319"],[0.90079186343164852,"#7C2319"],[0.90081173877165843,"#7C2319"],[0.90085406756819408,"#7C2319"],[0.90148160656825616,"#7C2218"],[0.90174146818729028,"#7C2218"],[0.90198903994187829,"#7C2218"],[0.90207473361764245,"#7C2218"],[0.90239436623142155,"#7C2218"],[0.90299088835723007,"#7C2218"],[0.90313512137040097,"#7C2218"],[0.90320967271259944,"#7C2218"],[0.90329776355770641,"#7C2218"],[0.90400771922035217,"#7C2218"],[0.9040094862398218,"#7C2218"],[0.90401633298668982,"#7C2218"],[0.90407466096133593,"#7C2218"],[0.9042282733652498,"#7C2218"],[0.90515282393134078,"#7C2118"],[0.90526666361022712,"#7C2118"],[0.90558463996371019,"#7B2118"],[0.90571440156857919,"#7B2118"],[0.90573711420515257,"#7B2118"],[0.90593016763674727,"#7B2118"],[0.90624847246718288,"#7B2117"],[0.90639783786878547,"#7B2117"],[0.90653383187244818,"#7B2117"],[0.90711779406213666,"#7B2117"],[0.90717190459673636,"#7B2117"],[0.90729634114587909,"#7B2117"],[0.90781450830721189,"#7B2117"],[0.90803520147403993,"#7B2117"],[0.90817177321724107,"#7B2117"],[0.90821795830881535,"#7B2117"],[0.90860683483297433,"#7B2117"],[0.90871023424361397,"#7B2017"],[0.9088366546801534,"#7B2017"],[0.90905994452454419,"#7B2017"],[0.90942013241373454,"#7B2017"],[0.90957461981195253,"#7B2017"],[0.90966750924117123,"#7B2017"],[0.91004957149144317,"#7B2017"],[0.9102475308157908,"#7B2017"],[0.91060135728087743,"#7B2017"],[0.91072024432887533,"#7B2017"],[0.91085391451424202,"#7B2016"],[0.91101100967908633,"#7B2016"],[0.91139240506329111,"#7A2016"],[0.91144374088320523,"#7A2016"],[0.91148720213997958,"#7A2016"],[0.91152277722932473,"#7A2016"],[0.9115860571766401,"#7A2016"],[0.91186175805154812,"#7A2016"],[0.91226086393563033,"#7A2016"],[0.91258876049876503,"#7A1F16"],[0.91278701381725913,"#7A1F16"],[0.91284464402445087,"#7A1F16"],[0.91302544109776118,"#7A1F16"],[0.91302787889461767,"#7A1F16"],[0.91313800535230571,"#7A1F16"],[0.91317474521174735,"#7A1F16"],[0.9132211497042555,"#7A1F16"],[0.91327149042220346,"#7A1F16"],[0.9132992390167326,"#7A1F16"],[0.91360273165926964,"#7A1F16"],[0.91407700319865948,"#7A1F16"],[0.91411216982873611,"#7A1F16"],[0.91501814398105197,"#7A1F16"],[0.91531127412696811,"#7A1F16"],[0.91544355161953139,"#7A1F16"],[0.91557390212687895,"#7A1F16"],[0.9156583169806839,"#7A1F16"],[0.91572055152726195,"#7A1F16"],[0.91648735610140175,"#7A1E15"],[0.91663828248083212,"#7A1E15"],[0.91672479467736734,"#7A1E15"],[0.91760275743610853,"#791E15"],[0.91768770746368689,"#791E15"],[0.91783387231134639,"#791E15"],[0.91785516133401424,"#791E15"],[0.91821831194363412,"#791E15"],[0.91838893285288925,"#791E15"],[0.9186549819374682,"#791E15"],[0.91916439513292814,"#791E15"],[0.91964154782901397,"#791D15"],[0.91968891732208724,"#791D15"],[0.92000790519985143,"#791D15"],[0.92007790313763904,"#791D15"],[0.92025968042160233,"#791D15"],[0.92056000882866473,"#791D15"],[0.92071427582413889,"#791D14"],[0.92140797718884482,"#791D14"],[0.92157891437627337,"#791D14"],[0.92165978689411399,"#791D14"],[0.92169050778502415,"#791D14"],[0.92218314840564009,"#791D14"],[0.92230461349174442,"#791D14"],[0.92265644756198939,"#791D14"],[0.92288332719294552,"#781D14"],[0.92309902080887452,"#781C14"],[0.9232082679900051,"#781C14"],[0.92350645420779542,"#781C14"],[0.92359796816631834,"#781C14"],[0.92405063291139244,"#781C14"],[0.92421662043712016,"#781C14"],[0.92451247061454445,"#781C14"],[0.92451415586536645,"#781C14"],[0.92456514717343097,"#781C14"],[0.92489552970336275,"#781C14"],[0.92504471912360164,"#781C14"],[0.92519349799234751,"#781C14"],[0.92540706121243432,"#781C14"],[0.92550090982155342,"#781C14"],[0.92553549314222061,"#781C14"],[0.92557835303864067,"#781C13"],[0.92570008988995212,"#781C13"],[0.92597408608034271,"#781C13"],[0.92669977086642252,"#781B13"],[0.92674273308921618,"#781B13"],[0.92732251151438261,"#781B13"],[0.9273658420797769,"#781B13"],[0.92742365640892066,"#781B13"],[0.92818951559911556,"#781B13"],[0.92860699457386775,"#771B13"],[0.92886461794850561,"#771B13"],[0.92918976171198375,"#771B13"],[0.92926884574131208,"#771B13"],[0.92979231055572908,"#771B13"],[0.92982402401650122,"#771B13"],[0.93067628697422289,"#771A12"],[0.93096941774623687,"#771A12"],[0.9309700320370955,"#771A12"],[0.93100489830102906,"#771A12"],[0.93179495839340809,"#771A12"],[0.93204142556715319,"#771A12"],[0.93214960460381868,"#771A12"],[0.93270129855306561,"#771A12"],[0.93303462319084496,"#771A12"],[0.93311825340533661,"#771A12"],[0.93316010775193392,"#771A12"],[0.93394609751345792,"#771912"],[0.9343210710455041,"#761912"],[0.93438162119607171,"#761912"],[0.93449431212486023,"#761912"],[0.93477242250034687,"#761912"],[0.93520204874445223,"#761912"],[0.93551032493873876,"#761911"],[0.93564063631414596,"#761911"],[0.93600632415988116,"#761911"],[0.93615673878314931,"#761911"],[0.93670886075949367,"#761811"],[0.93682503167523934,"#761811"],[0.93684718369760012,"#761811"],[0.9371642052633895,"#761811"],[0.93725333923990783,"#761811"],[0.93752065633936377,"#761811"],[0.93757106481392827,"#761811"],[0.93777651441289644,"#761811"],[0.93793053550081773,"#761811"],[0.93798196086553387,"#761811"],[0.93811747675938595,"#761811"],[0.93907122322198289,"#761811"],[0.93914015616240931,"#761811"],[0.93926883109613324,"#761811"],[0.93937329634969613,"#761811"],[0.94050191413897177,"#751710"],[0.94059016780477833,"#751710"],[0.94124484017058552,"#751710"],[0.94143783600907915,"#751710"],[0.94185800921150609,"#751710"],[0.94189940900179214,"#751710"],[0.94305816888643446,"#751710"],[0.94313417146620937,"#751610"],[0.94317724727723706,"#751610"],[0.94371593475125259,"#751610"],[0.94432490406760117,"#751610"],[0.94442552165388804,"#751610"],[0.94506145125991547,"#751610"],[0.94542461498448871,"#75160F"],[0.94552084260995395,"#74160F"],[0.94597197541263278,"#74160F"],[0.94642769855267606,"#74150F"],[0.9468923212839877,"#74150F"],[0.94695163430598406,"#74150F"],[0.94732863391370259,"#74150F"],[0.94797743240135923,"#74150F"],[0.94812209893709343,"#74150F"],[0.94820307566116291,"#74150F"],[0.94866415063718268,"#74150F"],[0.94880309655603334,"#74150F"],[0.949367088607595,"#74140F"],[0.94947774695808007,"#74140F"],[0.94981013050272423,"#74140E"],[0.95012899866156508,"#74140E"],[0.95032130195843556,"#74140E"],[0.95037061544545676,"#74140E"],[0.95038556869242719,"#74140E"],[0.95040586938582916,"#74140E"],[0.9504270337840971,"#74140E"],[0.95200385961017608,"#73140E"],[0.9520047431199109,"#73140E"],[0.95257641196567033,"#73130E"],[0.95286855710257623,"#73130E"],[0.95355889703106833,"#73130E"],[0.9545299722622721,"#73130D"],[0.95471006620686727,"#73130D"],[0.95502478574572158,"#73130D"],[0.95530067864043877,"#73120D"],[0.95639350690862956,"#73120D"],[0.95680136582963482,"#73120D"],[0.95705608491436811,"#72120D"],[0.957655637063484,"#72120D"],[0.9577217758097657,"#72120D"],[0.95880137871805426,"#72110C"],[0.95884385373184344,"#72110C"],[0.95958219756646401,"#72110C"],[0.95982077391450704,"#72110C"],[0.96012984021080117,"#72110C"],[0.96070398859442241,"#72110C"],[0.96082989344705694,"#72100C"],[0.96144166359647276,"#72100C"],[0.96202531645569622,"#72100B"],[0.96210831021856003,"#72100B"],[0.96244776485168138,"#72100B"],[0.96252235956180088,"#72100B"],[0.96270353060621716,"#71100B"],[0.9627504549107766,"#71100B"],[0.96278917651932039,"#71100B"],[0.96459488085599177,"#710F0B"],[0.96463442287065604,"#710F0B"],[0.96489615527786454,"#710F0B"],[0.9663506492765328,"#710E0A"],[0.96716053552275205,"#710E0A"],[0.96724715606243006,"#710E0A"],[0.96800316207994053,"#710E0A"],[0.96953561161099144,"#700D09"],[0.96957007808120466,"#700D09"],[0.96968664817484806,"#700D09"],[0.97092900460575304,"#700D09"],[0.97185796737562635,"#700C09"],[0.97216245203380058,"#700C08"],[0.97221276082694408,"#700C08"],[0.97321384927633792,"#700C08"],[0.97406104946854666,"#6F0B08"],[0.97410153783058151,"#6F0B08"],[0.97468354430379744,"#6F0B08"],[0.97473887347904009,"#6F0B08"],[0.97506449933078243,"#6F0B08"],[0.97519278434621348,"#6F0B08"],[0.97628820598283517,"#6F0A07"],[0.97726498613113599,"#6F0A07"],[0.97840068291481741,"#6F0907"],[0.97979109878323201,"#6E0906"],[0.98041494672352847,"#6E0806"],[0.98229744042799594,"#6E0705"],[0.98231721143532802,"#6E0705"],[0.98400158103997026,"#6E0705"],[0.98484332408742403,"#6E0605"],[0.98546450230287652,"#6E0604"],[0.98660692463816901,"#6D0604"],[0.98734177215189878,"#6D0504"],[0.98736943673952005,"#6D0504"],[0.9875963921731068,"#6D0504"],[0.98989554939161595,"#6D0403"],[0.99242166204371196,"#6C0302"],[0.99494777469580797,"#6C0202"],[0.99747388734790399,"#6B0101"],[1,"#6B0000"]],"type":"heatmap","showscale":false,"autocolorscale":false,"showlegend":false,"xaxis":"x","yaxis":"y","hoverinfo":"text","frame":null},{"x":[197.97750000000002,197.97750000000002,439.95000000000005,439.95000000000005,197.97750000000002],"y":[40.320000000000007,89.600000000000009,89.600000000000009,40.320000000000007,40.320000000000007],"text":"","type":"scatter","mode":"lines","line":{"width":1.5118110236220474,"color":"rgba(107,0,0,0.4)","dash":"dash"},"fill":"toself","fillcolor":"transparent","hoveron":"fills","showlegend":false,"xaxis":"x","yaxis":"y","hoverinfo":"text","frame":null},{"x":[316.76400000000001],"y":[86.016000000000005],"text":"The Oxfordian claim requires<br />books to cluster here.","hovertext":"","textfont":{"size":10.58267716535433,"color":"rgba(107,0,0,1)"},"type":"scatter","mode":"text","hoveron":"points","showlegend":false,"xaxis":"x","yaxis":"y","hoverinfo":"text","frame":null},{"x":[316.76400000000001],"y":[64.512],"text":"This zone is empty.","hovertext":"","textfont":{"size":12.09448818897638,"color":"rgba(107,0,0,1)"},"type":"scatter","mode":"text","hoveron":"points","showlegend":false,"xaxis":"x","yaxis":"y","hoverinfo":"text","frame":null},{"x":[66,0,3,16,5,1,4],"y":[56,20,4,22,1,8,12],"text":["<b>Ecclesiasticus<\/b><br>Shaheen refs: 66<br>Folger marks: 56<br>Strit. additions: 21<br>Matches: 1<br>Unknown","<b>2 Esdras<\/b><br>Shaheen refs: 0<br>Folger marks: 20<br>Strit. additions: 4<br>Matches: 0<br>Unknown","<b>Tobit<\/b><br>Shaheen refs: 3<br>Folger marks: 4<br>Strit. additions: 0<br>Matches: 0<br>Unknown","<b>Wisdom<\/b><br>Shaheen refs: 16<br>Folger marks: 22<br>Strit. additions: 8<br>Matches: 2<br>Unknown","<b>Judith<\/b><br>Shaheen refs: 5<br>Folger marks: 1<br>Strit. additions: 2<br>Matches: 1<br>Unknown","<b>Baruch<\/b><br>Shaheen refs: 1<br>Folger marks: 8<br>Strit. additions: 0<br>Matches: 0<br>Unknown","<b>2 Maccabees<\/b><br>Shaheen refs: 4<br>Folger marks: 12<br>Strit. additions: 0<br>Matches: 0<br>Unknown"],"type":"scatter","mode":"markers","marker":{"autocolorscale":false,"color":"rgba(170,170,170,1)","opacity":0.90000000000000002,"size":8.3149606299212611,"symbol":"circle","line":{"width":1.8897637795275593,"color":"rgba(170,170,170,1)"}},"hoveron":"points","name":"Apocrypha","legendgroup":"Apocrypha","showlegend":true,"xaxis":"x","yaxis":"y","hoverinfo":"text","frame":null},{"x":[416,121,297,61,76,112,85,43,20,68,19,13,12,3,18,7,8,27,48,42,25,131],"y":[7,1,1,3,1,7,5,9,0,0,2,2,3,1,0,2,1,0,3,1,0,30],"text":["<b>Matthew<\/b><br>Shaheen refs: 416<br>Folger marks: 7<br>Strit. additions: 0<br>Matches: 11<br>New Testament","<b>Mark<\/b><br>Shaheen refs: 121<br>Folger marks: 1<br>Strit. additions: 0<br>Matches: 6<br>New Testament","<b>Luke<\/b><br>Shaheen refs: 297<br>Folger marks: 1<br>Strit. additions: 1<br>Matches: 0<br>New Testament","<b>John<\/b><br>Shaheen refs: 61<br>Folger marks: 3<br>Strit. additions: 0<br>Matches: 0<br>New Testament","<b>Acts<\/b><br>Shaheen refs: 76<br>Folger marks: 1<br>Strit. additions: 0<br>Matches: 0<br>New Testament","<b>Romans<\/b><br>Shaheen refs: 112<br>Folger marks: 7<br>Strit. additions: 1<br>Matches: 3<br>New Testament","<b>1 Corinthians<\/b><br>Shaheen refs: 85<br>Folger marks: 5<br>Strit. additions: 0<br>Matches: 0<br>New Testament","<b>2 Corinthians<\/b><br>Shaheen refs: 43<br>Folger marks: 9<br>Strit. additions: 5<br>Matches: 1<br>New Testament","<b>Galatians<\/b><br>Shaheen refs: 20<br>Folger marks: 0<br>Strit. additions: 0<br>Matches: 0<br>New Testament","<b>Ephesians<\/b><br>Shaheen refs: 68<br>Folger marks: 0<br>Strit. additions: 0<br>Matches: 0<br>New Testament","<b>Colossians<\/b><br>Shaheen refs: 19<br>Folger marks: 2<br>Strit. additions: 0<br>Matches: 0<br>New Testament","<b>Philippians<\/b><br>Shaheen refs: 13<br>Folger marks: 2<br>Strit. additions: 2<br>Matches: 0<br>New Testament","<b>1 Thessalonians<\/b><br>Shaheen refs: 12<br>Folger marks: 3<br>Strit. additions: 1<br>Matches: 1<br>New Testament","<b>2 Thessalonians<\/b><br>Shaheen refs: 3<br>Folger marks: 1<br>Strit. additions: 0<br>Matches: 0<br>New Testament","<b>1 Timothy<\/b><br>Shaheen refs: 18<br>Folger marks: 0<br>Strit. additions: 0<br>Matches: 0<br>New Testament","<b>2 Timothy<\/b><br>Shaheen refs: 7<br>Folger marks: 2<br>Strit. additions: 0<br>Matches: 0<br>New Testament","<b>Titus<\/b><br>Shaheen refs: 8<br>Folger marks: 1<br>Strit. additions: 0<br>Matches: 0<br>New Testament","<b>James<\/b><br>Shaheen refs: 27<br>Folger marks: 0<br>Strit. additions: 0<br>Matches: 0<br>New Testament","<b>Hebrews<\/b><br>Shaheen refs: 48<br>Folger marks: 3<br>Strit. additions: 1<br>Matches: 0<br>New Testament","<b>1 Peter<\/b><br>Shaheen refs: 42<br>Folger marks: 1<br>Strit. additions: 3<br>Matches: 2<br>New Testament","<b>2 Peter<\/b><br>Shaheen refs: 25<br>Folger marks: 0<br>Strit. additions: 0<br>Matches: 0<br>New Testament","<b>Revelation<\/b><br>Shaheen refs: 131<br>Folger marks: 30<br>Strit. additions: 7<br>Matches: 8<br>New Testament"],"type":"scatter","mode":"markers","marker":{"autocolorscale":false,"color":"rgba(74,103,65,1)","opacity":0.90000000000000002,"size":8.3149606299212611,"symbol":"circle","line":{"width":1.8897637795275593,"color":"rgba(74,103,65,1)"}},"hoveron":"points","name":"NT","legendgroup":"NT","showlegend":true,"xaxis":"x","yaxis":"y","hoverinfo":"text","frame":null},{"x":[184,98,30,21,95,19,23,72,57,38,11,12,28,1,7,7,145,419,16,96,36,107,48,56,28,5,7,5,9,2,1,6,3],"y":[1,9,5,1,12,0,0,80,48,35,1,1,12,1,2,1,10,4,0,1,0,34,11,21,2,18,5,6,5,2,2,11,1],"text":["<b>Genesis<\/b><br>Shaheen refs: 184<br>Folger marks: 1<br>Strit. additions: 0<br>Matches: 0<br>Old Testament","<b>Exodus<\/b><br>Shaheen refs: 98<br>Folger marks: 9<br>Strit. additions: 4<br>Matches: 5<br>Old Testament","<b>Leviticus<\/b><br>Shaheen refs: 30<br>Folger marks: 5<br>Strit. additions: 1<br>Matches: 1<br>Old Testament","<b>Numbers<\/b><br>Shaheen refs: 21<br>Folger marks: 1<br>Strit. additions: 0<br>Matches: 0<br>Old Testament","<b>Deuteronomy<\/b><br>Shaheen refs: 95<br>Folger marks: 12<br>Strit. additions: 7<br>Matches: 1<br>Old Testament","<b>Joshua<\/b><br>Shaheen refs: 19<br>Folger marks: 0<br>Strit. additions: 0<br>Matches: 0<br>Old Testament","<b>Judges<\/b><br>Shaheen refs: 23<br>Folger marks: 0<br>Strit. additions: 0<br>Matches: 0<br>Old Testament","<b>1 Samuel<\/b><br>Shaheen refs: 72<br>Folger marks: 80<br>Strit. additions: 15<br>Matches: 18<br>Old Testament","<b>2 Samuel<\/b><br>Shaheen refs: 57<br>Folger marks: 48<br>Strit. additions: 6<br>Matches: 11<br>Old Testament","<b>1 Kings<\/b><br>Shaheen refs: 38<br>Folger marks: 35<br>Strit. additions: 2<br>Matches: 7<br>Old Testament","<b>2 Kings<\/b><br>Shaheen refs: 11<br>Folger marks: 1<br>Strit. additions: 0<br>Matches: 0<br>Old Testament","<b>1 Chronicles<\/b><br>Shaheen refs: 12<br>Folger marks: 1<br>Strit. additions: 0<br>Matches: 4<br>Old Testament","<b>2 Chronicles<\/b><br>Shaheen refs: 28<br>Folger marks: 12<br>Strit. additions: 2<br>Matches: 0<br>Old Testament","<b>Ezra<\/b><br>Shaheen refs: 1<br>Folger marks: 1<br>Strit. additions: 0<br>Matches: 0<br>Old Testament","<b>Nehemiah<\/b><br>Shaheen refs: 7<br>Folger marks: 2<br>Strit. additions: 0<br>Matches: 0<br>Old Testament","<b>Esther<\/b><br>Shaheen refs: 7<br>Folger marks: 1<br>Strit. additions: 0<br>Matches: 0<br>Old Testament","<b>Job<\/b><br>Shaheen refs: 145<br>Folger marks: 10<br>Strit. additions: 0<br>Matches: 4<br>Old Testament","<b>Psalms<\/b><br>Shaheen refs: 419<br>Folger marks: 4<br>Strit. additions: 0<br>Matches: 5<br>Old Testament","<b>Lamentations<\/b><br>Shaheen refs: 16<br>Folger marks: 0<br>Strit. additions: 0<br>Matches: 0<br>Old Testament","<b>Proverbs<\/b><br>Shaheen refs: 96<br>Folger marks: 1<br>Strit. additions: 0<br>Matches: 0<br>Old Testament","<b>Ecclesiastes<\/b><br>Shaheen refs: 36<br>Folger marks: 0<br>Strit. additions: 1<br>Matches: 0<br>Old Testament","<b>Isaiah<\/b><br>Shaheen refs: 107<br>Folger marks: 34<br>Strit. additions: 2<br>Matches: 5<br>Old Testament","<b>Jeremiah<\/b><br>Shaheen refs: 48<br>Folger marks: 11<br>Strit. additions: 0<br>Matches: 2<br>Old Testament","<b>Ezekiel<\/b><br>Shaheen refs: 56<br>Folger marks: 21<br>Strit. additions: 6<br>Matches: 4<br>Old Testament","<b>Daniel<\/b><br>Shaheen refs: 28<br>Folger marks: 2<br>Strit. additions: 0<br>Matches: 0<br>Old Testament","<b>Hosea<\/b><br>Shaheen refs: 5<br>Folger marks: 18<br>Strit. additions: 7<br>Matches: 1<br>Old Testament","<b>Joel<\/b><br>Shaheen refs: 7<br>Folger marks: 5<br>Strit. additions: 0<br>Matches: 1<br>Old Testament","<b>Amos<\/b><br>Shaheen refs: 5<br>Folger marks: 6<br>Strit. additions: 0<br>Matches: 0<br>Old Testament","<b>Micah<\/b><br>Shaheen refs: 9<br>Folger marks: 5<br>Strit. additions: 0<br>Matches: 2<br>Old Testament","<b>Nahum<\/b><br>Shaheen refs: 2<br>Folger marks: 2<br>Strit. additions: 0<br>Matches: 0<br>Old Testament","<b>Zephaniah<\/b><br>Shaheen refs: 1<br>Folger marks: 2<br>Strit. additions: 0<br>Matches: 0<br>Old Testament","<b>Zechariah<\/b><br>Shaheen refs: 6<br>Folger marks: 11<br>Strit. additions: 0<br>Matches: 0<br>Old Testament","<b>Malachi<\/b><br>Shaheen refs: 3<br>Folger marks: 1<br>Strit. additions: 0<br>Matches: 0<br>Old Testament"],"type":"scatter","mode":"markers","marker":{"autocolorscale":false,"color":"rgba(107,58,42,1)","opacity":0.90000000000000002,"size":8.3149606299212611,"symbol":"circle","line":{"width":1.8897637795275593,"color":"rgba(107,58,42,1)"}},"hoveron":"points","name":"OT","legendgroup":"OT","showlegend":true,"xaxis":"x","yaxis":"y","hoverinfo":"text","frame":null},{"showlegend":false,"xaxis":"x","yaxis":"y","hoverinfo":"text","frame":null}],"layout":{"margin":{"t":38.581984225819845,"r":6.6417600664176026,"b":32.54462432544625,"l":32.54462432544625},"paper_bgcolor":"rgba(255,255,255,1)","font":{"color":"rgba(0,0,0,1)","family":"sans","size":13.283520132835198},"title":{"text":"<b> Where the annotator marked and where Shakespeare looked <\/b>","font":{"color":"rgba(61,14,14,1)","family":"sans","size":15.940224159402243},"x":0,"xref":"paper"},"xaxis":{"domain":[0,1],"automargin":true,"type":"linear","autorange":false,"range":[-11.694873417721521,451.64487341772156],"tickmode":"array","ticktext":["0","100","200","300","400"],"tickvals":[0,100,200,300,400],"categoryorder":"array","categoryarray":["0","100","200","300","400"],"nticks":null,"ticks":"","tickcolor":null,"ticklen":3.3208800332087995,"tickwidth":0,"showticklabels":true,"tickfont":{"color":"rgba(77,77,77,1)","family":"sans","size":10.62681610626816},"tickangle":-0,"showline":false,"linecolor":null,"linewidth":0,"showgrid":true,"gridcolor":"rgba(238,235,227,1)","gridwidth":0.39850560398505613,"zeroline":false,"anchor":"y","title":{"text":"Shaheen references (plays that quote this book)","font":{"color":"rgba(68,68,68,1)","family":"sans","size":11.955168119551683}},"hoverformat":".2f"},"yaxis":{"domain":[0,1],"automargin":true,"type":"linear","autorange":false,"range":[-5.1037974683544318,94.703797468354438],"tickmode":"array","ticktext":["0","25","50","75"],"tickvals":[0,25.000000000000004,50,75],"categoryorder":"array","categoryarray":["0","25","50","75"],"nticks":null,"ticks":"","tickcolor":null,"ticklen":3.3208800332088013,"tickwidth":0,"showticklabels":true,"tickfont":{"color":"rgba(77,77,77,1)","family":"sans","size":10.62681610626816},"tickangle":-0,"showline":false,"linecolor":null,"linewidth":0,"showgrid":true,"gridcolor":"rgba(238,235,227,1)","gridwidth":0.39850560398505613,"zeroline":false,"anchor":"x","title":{"text":"Folger marks (annotator's marks in this book)","font":{"color":"rgba(68,68,68,1)","family":"sans","size":11.955168119551683}},"hoverformat":".2f"},"shapes":[],"showlegend":true,"legend":{"bgcolor":null,"bordercolor":null,"borderwidth":0,"font":{"color":"rgba(0,0,0,1)","family":"sans","size":11.955168119551683},"orientation":"h","x":0.5,"y":1.0800000000000001,"xanchor":"center","yanchor":"bottom","title":{"text":"","font":{"color":"rgba(0,0,0,1)","family":"sans","size":13.283520132835198}}},"hovermode":"closest","barmode":"relative","hoverlabel":{"bgcolor":"#1a1a1a","font":{"family":"Fira Sans Condensed, sans-serif","size":12,"color":"#f5f1e8"},"bordercolor":"#3d0e0e"}},"config":{"doubleClick":"reset","modeBarButtonsToAdd":["hoverclosest","hovercompare"],"showSendToCloud":false},"source":"A","attrs":{"17d86275b2e":{"x":{},"y":{},"fill":{},"type":"heatmap"},"17d884717dc":{"xmin":{},"xmax":{},"ymin":{},"ymax":{}},"17d8122f1ef3":{"x":{},"y":{}},"17d8609e1222":{"x":{},"y":{}},"17d84eb6478b":{"x":{},"y":{},"colour":{},"text":{}},"17d82b8a4585":{"x":{},"y":{},"label":{}}},"cur_data":"17d86275b2e","visdat":{"17d86275b2e":["function (y) ","x"],"17d884717dc":["function (y) ","x"],"17d8122f1ef3":["function (y) ","x"],"17d8609e1222":["function (y) ","x"],"17d84eb6478b":["function (y) ","x"],"17d82b8a4585":["function (y) ","x"]},"highlight":{"on":"plotly_click","persistent":false,"dynamic":false,"selectize":false,"opacityDim":0.20000000000000001,"selected":{"opacity":1},"debounce":0},"shinyEvents":["plotly_hover","plotly_click","plotly_selected","plotly_relayout","plotly_brushed","plotly_brushing","plotly_clickannotation","plotly_doubleclick","plotly_deselect","plotly_afterplot","plotly_sunburstclick"],"base_url":"https://plot.ly"},"evals":[],"jsHooks":[]}</script>Each point is one Bible book. Books in the top-right would support the Oxfordian claim — many marks and many Shakespeare references. There are none. ::: :::
Each point represents one bible book with its collection of marks and references. For there to be any promise of a relationship, the dots should come together toward the top right of the chart, showing a preponderance of shared interest. The chart shows the precise opposite. The area where any relationship should be visible is completely blank. The chart is interactive, you can scale, zoom, reveal the data behind each point one mouseover but however long you spend, you can not even begin to imagine a relationship between marks and references that connectors the annotators of the Bible to the author of the plays. The data will not help though we are happy to offer it to anyone hwo wants to try. Like prisoners, data cannot be forced into telling you what they do not know.
The chart above shows virgin white space, lots of it, where the marks of any relationship between references and annotations would appear, thickly clustering if any authorship conclusions are to be mooted. There’s nothing there. Below there is a live summary table from the dataframe, Again, there’s nothing there. Nothing suggestive, nothing relational, nothing worthy of investigation. Anyone who has worked the data, knows this. It was an obvious hopeless quest, Even Dr Stritmatter knows this. He explained to me, after he looked at the charts, that the relationship between the annotators and the references was hermeneutic in nature, perhaps hoping that I didn’t know what it meant.
Speaking about himself in the third person in the old-fashioned and annoying habit senior academics once had, he tried to make it clear:
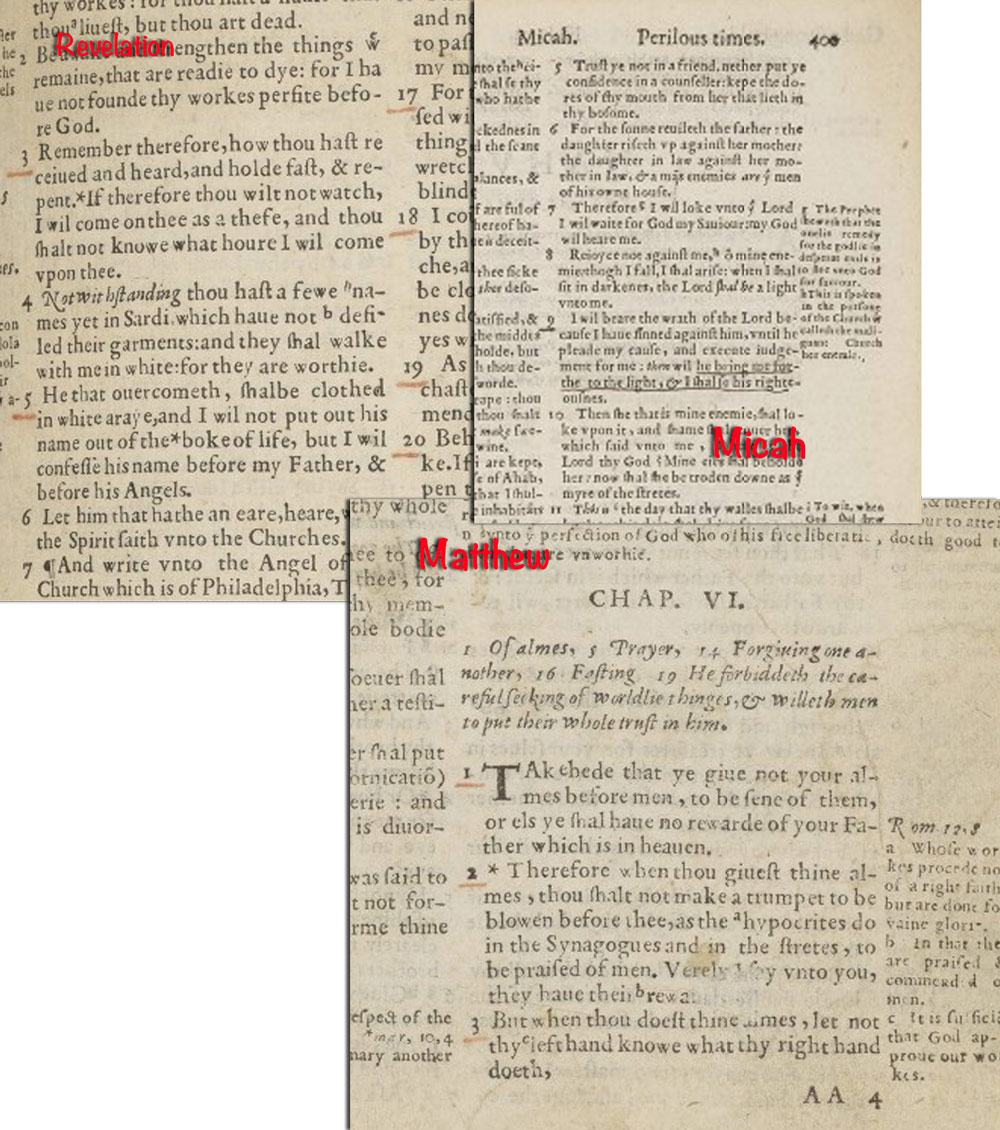
In fact, Stritmatter in his dissertation goes out of his way to make clear that his conclusions do not depend on any statistical operations: “Literary reasoning” is the process of the interpretation of literary texts to form conclusions about their meaning and significance. In literary reasoning, numerical symbols can play a role, but they are never the whole story. They are also not things-in-themselves; they are subordinate to logic and literary inference, to which they contribute when statistically robust. No matter how impressive the number of marked verses which demonstrate an influence in “Shakespeare,” the inner story of these annotations is not told by numbers, but in the brief sequence of marked verses (Micah 7.9, Matthew 6.1-4 and Revelations 3.5: see chapter 26) which comment on the condition of a man whose name has been erased from history and which set forth the divine promise of his eventual redemption. This is a matter of hermeneutics, not calculus.”
This is a matter of allowing a fanciful proposition to occlude judgement from the vrey beginning. Even if the realtionship looked promising, conclusive even, what would Stritmatter have proved? no more than the annotators were very familiar with Shakespeare’s work. Most Londoners were. The authorship needle would not have moved had the results been 10 times or even 50 times more favourable.
In Short
After grinding the numbers, our view, strengthened over time, is that the relationship between marks and references highlights the differences between the annotators and the playwright, rather than the reverse. Even when they both make lots of marks in the same book they rarely have much in common.
The playwright likes the New Testament. The annotators are keener of The Old.
Shakespeare is soaked in references to Genesis, the annotators have marked only one verse, which the playwright ignored. There is nothing approaching statistical support for the idea that the marks are made by the playwright. In fact, there’s nothing to support the idea that the 17th Earl of Oxford was responsible for all or even any of the annotations. The whole idea is nothing more than another Oxfordian mirage.
| Most popular references | Unmarked (Shaheen) | Marked | % | Stritmatter additions | % | Total | % |
|---|---|---|---|---|---|---|---|
| First 100 | 593 | 14 | 2.36% | 62 | 10.46% | 76 | 12.82% |
| First 1,000 | 2,314 | 93 | 4.02% | 174 | 7.52% | 267 | 11.54% |
| First 2,500 | 3,496 | 93 | 2.66% | 197 | 5.64% | 290 | 8.30% |
| Percentages calculated as a proportion of Shaheen references only. Verses ranked by combined total of all reference types. Figures reflect the current dataset. | |||||||
Chart 2 — The dashboard: chapter by chapter
Text about the dashboard goes here.
The complete data: all Bible books
Text about the sortable table goes here.